Estimated Value: $250,740 - $264,000
3
Beds
2
Baths
1,763
Sq Ft
$146/Sq Ft
Est. Value
About This Home
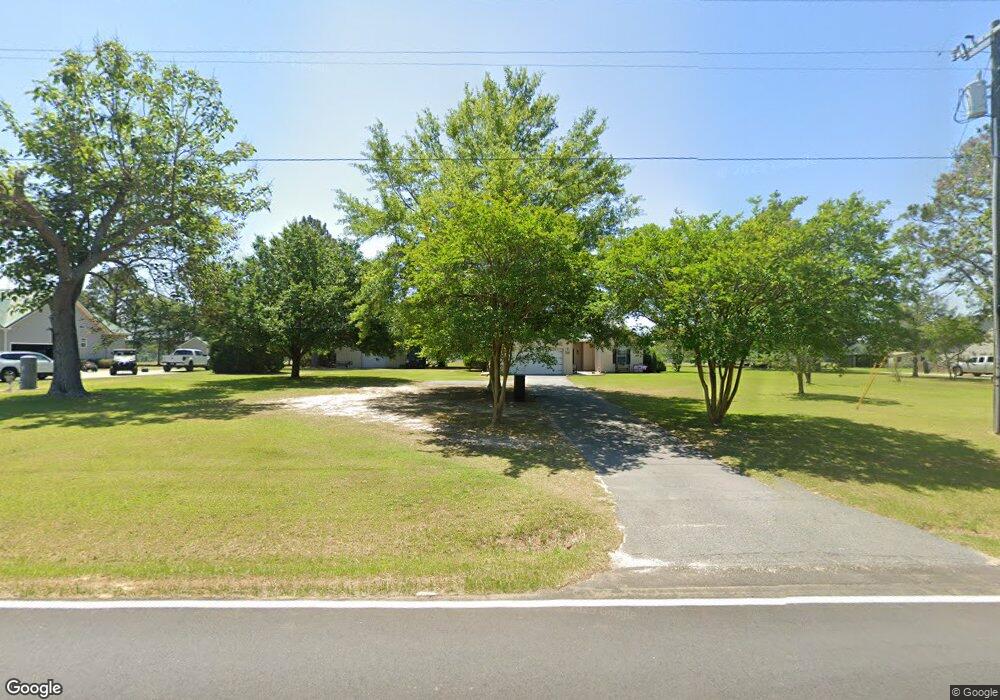
This home is located at 680 Chula Brookfield Rd, Chula, GA 31733 and is currently estimated at $256,580, approximately $145 per square foot. 680 Chula Brookfield Rd is a home located in Tift County with nearby schools including Len Lastinger Primary School, Matt Wilson Elementary School, and J.T. Reddick School.
Ownership History
Date
Name
Owned For
Owner Type
Purchase Details
Closed on
Dec 1, 2006
Sold by
Haswell Jarrett P
Bought by
Lamb Jimmy C and Lamb Melody
Current Estimated Value
Home Financials for this Owner
Home Financials are based on the most recent Mortgage that was taken out on this home.
Original Mortgage
$140,000
Outstanding Balance
$79,253
Interest Rate
6.29%
Mortgage Type
New Conventional
Estimated Equity
$177,327
Purchase Details
Closed on
May 18, 2005
Sold by
Haswell Jason L
Bought by
Haswell Jarrett P
Purchase Details
Closed on
Jan 16, 2004
Sold by
Catchot Angus L and Catchot Beverly D
Bought by
Haswell Jason
Purchase Details
Closed on
Aug 8, 2003
Sold by
Dozier William A and Dozier Kristy L
Bought by
Catchot Angus L and Catchot Beverly D
Purchase Details
Closed on
Jun 19, 2000
Sold by
Link Enterprises Inc
Bought by
Dozier William A
Purchase Details
Closed on
Mar 3, 1997
Bought by
Link Enterprises Inc
Create a Home Valuation Report for This Property
The Home Valuation Report is an in-depth analysis detailing your home's value as well as a comparison with similar homes in the area
Purchase History
| Date | Buyer | Sale Price | Title Company |
|---|---|---|---|
| Lamb Jimmy C | $140,000 | -- | |
| Haswell Jarrett P | $124,000 | -- | |
| Haswell Jason | $118,000 | -- | |
| Catchot Angus L | $115,000 | -- | |
| Dozier William A | $110,000 | -- | |
| Link Enterprises Inc | $3,200 | -- |
Source: Public Records
Mortgage History
| Date | Status | Borrower | Loan Amount |
|---|---|---|---|
| Open | Lamb Jimmy C | $140,000 |
Source: Public Records
Tax History
| Year | Tax Paid | Tax Assessment Tax Assessment Total Assessment is a certain percentage of the fair market value that is determined by local assessors to be the total taxable value of land and additions on the property. | Land | Improvement |
|---|---|---|---|---|
| 2024 | $1,807 | $84,837 | $2,373 | $82,464 |
| 2023 | $1,662 | $52,201 | $3,000 | $49,201 |
| 2022 | $1,490 | $52,201 | $3,000 | $49,201 |
| 2021 | $1,499 | $52,201 | $3,000 | $49,201 |
| 2020 | $1,528 | $52,201 | $3,000 | $49,201 |
| 2019 | $1,524 | $52,201 | $3,000 | $49,201 |
| 2018 | $1,522 | $52,201 | $3,000 | $49,201 |
| 2017 | $1,529 | $52,201 | $3,000 | $49,201 |
| 2016 | $1,509 | $51,492 | $3,000 | $48,492 |
| 2015 | $1,509 | $51,492 | $3,000 | $48,492 |
| 2014 | $1,513 | $51,492 | $3,000 | $48,492 |
| 2013 | -- | $51,492 | $3,000 | $48,492 |
Source: Public Records
Map
Nearby Homes
- 18 Hank Mike Rd
- 746 Chula Brookfield Rd
- 50 Hank Mike Rd
- 64 Hank Mike Rd
- 795 Chula Brookfield Rd
- 37 Duane Dr
- 257 Adams Rd
- 277 Wesley Rigdon Rd
- 87 Waterfront St
- n/a Wiley Branch Rd
- 100 Long Pine Rd
- 0 Brighton Rd
- 897 Wiley Branch Rd
- 136 S Access Rd
- 142 Brighton Rd
- 50 Margaret Ln
- 901 Wiley Branch Rd
- 1576 Chula Brookfield Rd
- 68 Rose Ave
- 5704 Forest Lake Dr W
- 688 Chula Brookfield Rd
- 674 Chula Brookfield Rd
- 685 Chula Brookfield Rd
- 675 Chula Brookfield Rd
- 668 Chula Brookfield Rd
- 696 Chula Brookfield Rd
- 693 Chula Brookfield Rd
- 667 Chula Brookfield Rd
- 698 Chula Brookfield Rd
- 4956 Ga Highway 125 N
- 4970 Ga Highway 125 N
- 4967 Ga Highway 125 N
- 4947 Ga Highway 125 N
- 701 Chula Brookfield Rd
- 5106 Ga Highway 125 N
- 711 Chula Brookfield Rd
- 5089 Georgia 125
- 5099 Georgia 125
- 5099 Ga Highway 125 N
- 5089 Ga Highway 125 N
Your Personal Tour Guide
Ask me questions while you tour the home.