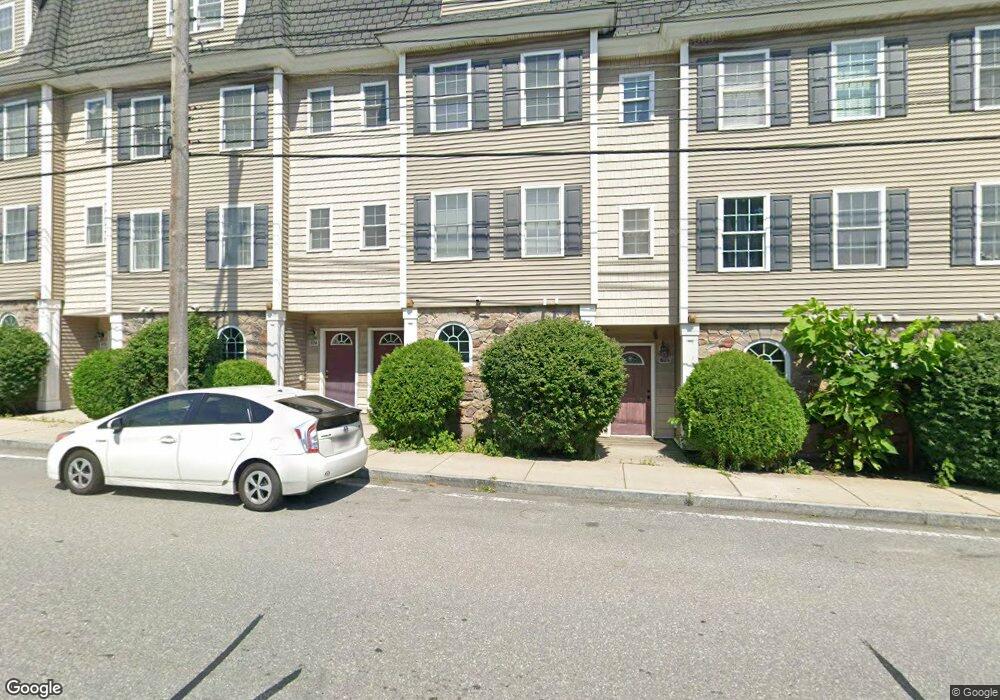
680 Gorham St Unit 680 Lowell, MA 01852
Back Central NeighborhoodEstimated Value: $453,000 - $591,000
4
Beds
3
Baths
2,020
Sq Ft
$258/Sq Ft
Est. Value
About This Home
This home is located at 680 Gorham St Unit 680, Lowell, MA 01852 and is currently estimated at $521,089, approximately $257 per square foot. 680 Gorham St Unit 680 is a home located in Middlesex County with nearby schools including Moody Elementary School, Abraham Lincoln Elementary School, and Greenhalge Elementary School.
Ownership History
Date
Name
Owned For
Owner Type
Purchase Details
Closed on
Jun 7, 2021
Sold by
Magararu Jose and Demars Andrew
Bought by
Magararu Jose
Current Estimated Value
Home Financials for this Owner
Home Financials are based on the most recent Mortgage that was taken out on this home.
Original Mortgage
$220,900
Outstanding Balance
$199,997
Interest Rate
2.9%
Mortgage Type
Stand Alone Refi Refinance Of Original Loan
Estimated Equity
$321,092
Purchase Details
Closed on
Mar 30, 2007
Sold by
Modern Re Dev Corp
Bought by
Demars Andrew and Magararu Jose
Home Financials for this Owner
Home Financials are based on the most recent Mortgage that was taken out on this home.
Original Mortgage
$199,425
Interest Rate
6.33%
Mortgage Type
Purchase Money Mortgage
Create a Home Valuation Report for This Property
The Home Valuation Report is an in-depth analysis detailing your home's value as well as a comparison with similar homes in the area
Home Values in the Area
Average Home Value in this Area
Purchase History
| Date | Buyer | Sale Price | Title Company |
|---|---|---|---|
| Magararu Jose | -- | None Available | |
| Magararu Jose | -- | None Available | |
| Demars Andrew | $265,900 | -- | |
| Demars Andrew | $265,900 | -- |
Source: Public Records
Mortgage History
| Date | Status | Borrower | Loan Amount |
|---|---|---|---|
| Open | Magararu Jose | $220,900 | |
| Closed | Magararu Jose | $220,900 | |
| Previous Owner | Demars Andrew | $199,425 |
Source: Public Records
Tax History Compared to Growth
Tax History
| Year | Tax Paid | Tax Assessment Tax Assessment Total Assessment is a certain percentage of the fair market value that is determined by local assessors to be the total taxable value of land and additions on the property. | Land | Improvement |
|---|---|---|---|---|
| 2025 | $4,345 | $378,500 | $0 | $378,500 |
| 2024 | $4,097 | $344,000 | $0 | $344,000 |
| 2023 | $3,779 | $304,300 | $0 | $304,300 |
| 2022 | $3,593 | $283,100 | $0 | $283,100 |
| 2021 | $3,497 | $259,800 | $0 | $259,800 |
| 2020 | $3,361 | $251,600 | $0 | $251,600 |
| 2019 | $3,719 | $264,900 | $0 | $264,900 |
| 2018 | $3,540 | $246,000 | $0 | $246,000 |
| 2017 | $3,500 | $234,600 | $0 | $234,600 |
| 2016 | $3,267 | $215,500 | $0 | $215,500 |
| 2015 | $3,176 | $205,200 | $0 | $205,200 |
| 2013 | $3,056 | $203,600 | $0 | $203,600 |
Source: Public Records
Map
Nearby Homes
- 762 Gorham St Unit 3
- 8 Cedar Ct
- 43 Cedar St
- 46 Lyons St
- 95 S Highland St
- 42 Keene St
- 834 Central St
- 15 Whipple St
- 14 Watson St Unit 4
- 70 Elm St
- 195 Thorndike St Unit 4
- 9 Watson St
- 201 Thorndike St Unit 2-05
- 201 Thorndike St Unit 501
- 201 Thorndike St Unit 2-312
- 24 Richmond Ave
- 540 Lawrence St
- 8 Cherry St
- 31 Merrill St
- 84 Cambridge St