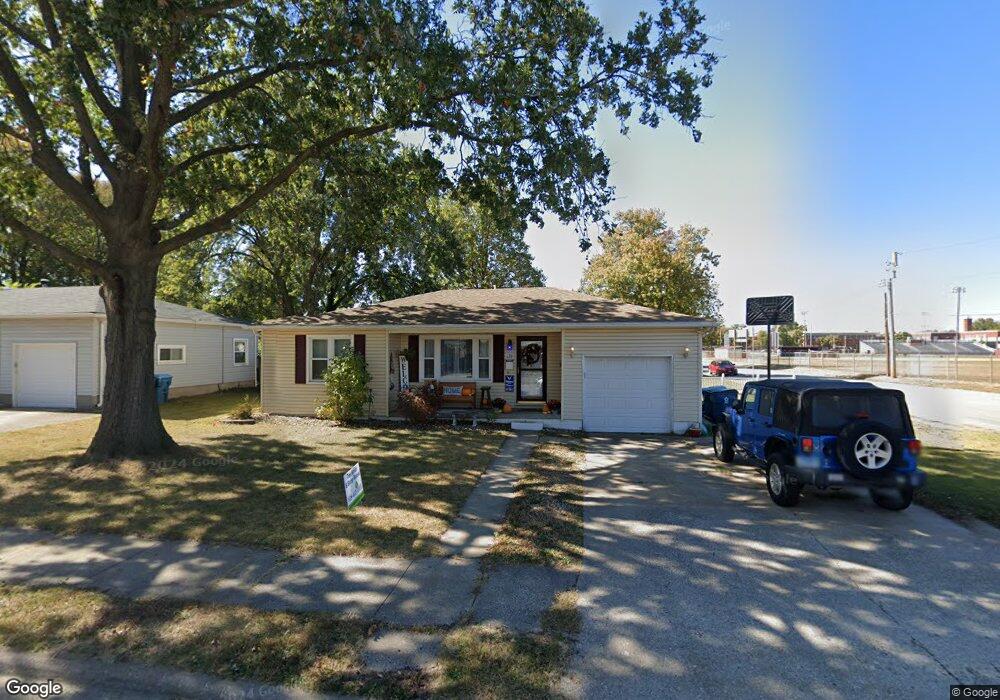
680 N 2nd St Wood River, IL 62095
Estimated Value: $124,000 - $150,000
3
Beds
2
Baths
876
Sq Ft
$153/Sq Ft
Est. Value
About This Home
This home is located at 680 N 2nd St, Wood River, IL 62095 and is currently estimated at $133,685, approximately $152 per square foot. 680 N 2nd St is a home located in Madison County with nearby schools including Eastwood Elementary School, East Alton Middle School, and East Alton-Wood River High School.
Ownership History
Date
Name
Owned For
Owner Type
Purchase Details
Closed on
Jun 17, 2011
Sold by
Barber Phillip J and Barber Tara
Bought by
Moore Amanda J
Current Estimated Value
Home Financials for this Owner
Home Financials are based on the most recent Mortgage that was taken out on this home.
Original Mortgage
$73,406
Outstanding Balance
$50,889
Interest Rate
4.75%
Mortgage Type
FHA
Estimated Equity
$82,796
Purchase Details
Closed on
Sep 10, 2010
Sold by
Barber Phillip J
Bought by
Barber Phillip J and Barber Tara
Purchase Details
Closed on
Oct 16, 2006
Sold by
Hamilton Kevin E and Hamilton Mary A
Bought by
Barber Phillip J and Barber Tara
Home Financials for this Owner
Home Financials are based on the most recent Mortgage that was taken out on this home.
Original Mortgage
$203,000
Interest Rate
6.5%
Mortgage Type
Purchase Money Mortgage
Create a Home Valuation Report for This Property
The Home Valuation Report is an in-depth analysis detailing your home's value as well as a comparison with similar homes in the area
Home Values in the Area
Average Home Value in this Area
Purchase History
| Date | Buyer | Sale Price | Title Company |
|---|---|---|---|
| Moore Amanda J | $78,500 | Community Title & Escrow Ltd | |
| Barber Phillip J | -- | Serenity Title & Escrow Ltd | |
| Barber Phillip J | $135,000 | Premier Title & Escrow Co |
Source: Public Records
Mortgage History
| Date | Status | Borrower | Loan Amount |
|---|---|---|---|
| Open | Moore Amanda J | $73,406 | |
| Previous Owner | Barber Phillip J | $203,000 |
Source: Public Records
Tax History Compared to Growth
Tax History
| Year | Tax Paid | Tax Assessment Tax Assessment Total Assessment is a certain percentage of the fair market value that is determined by local assessors to be the total taxable value of land and additions on the property. | Land | Improvement |
|---|---|---|---|---|
| 2024 | $2,274 | $32,420 | $5,120 | $27,300 |
| 2023 | $2,274 | $30,220 | $4,770 | $25,450 |
| 2022 | $2,122 | $27,890 | $4,400 | $23,490 |
| 2021 | $1,864 | $25,990 | $4,100 | $21,890 |
| 2020 | $1,802 | $25,030 | $3,950 | $21,080 |
| 2019 | $1,720 | $24,280 | $3,830 | $20,450 |
| 2018 | $2,346 | $30,370 | $3,640 | $26,730 |
| 2017 | $2,199 | $29,640 | $3,550 | $26,090 |
| 2016 | $2,156 | $29,640 | $3,550 | $26,090 |
| 2015 | $2,140 | $29,320 | $3,510 | $25,810 |
| 2014 | $2,140 | $29,320 | $3,510 | $25,810 |
| 2013 | $2,140 | $29,740 | $3,560 | $26,180 |
Source: Public Records
Map
Nearby Homes
- 641 Leslie Ave
- 469 N 1st St
- 777 Condit St
- 537 Tipton Ave
- 830 N Wood River Ave
- 959 Cedar Dr
- 523 Wilson Ave
- 726 Rice St
- 565 5th St
- 529 5th St
- 207 E Penning Ave
- 104 Whitelaw Ave
- 98 Wood River Ave
- 833 State St
- 121 Whitelaw Ave
- 458 N 6th St
- 41 W Penning Ave
- 72 E Acton Ave
- 345 Illinois Ave
- 242 E Lorena Ave