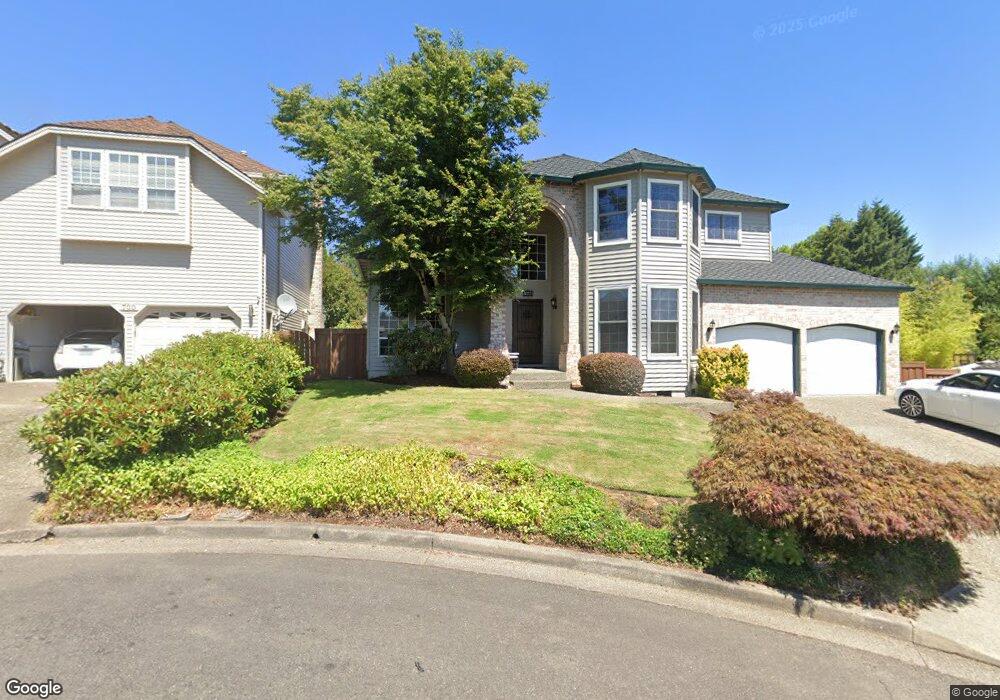
680 NW Altishin Place Beaverton, OR 97006
Five Oaks NeighborhoodEstimated Value: $727,696 - $852,000
3
Beds
3
Baths
2,431
Sq Ft
$327/Sq Ft
Est. Value
About This Home
This home is located at 680 NW Altishin Place, Beaverton, OR 97006 and is currently estimated at $794,674, approximately $326 per square foot. 680 NW Altishin Place is a home located in Washington County with nearby schools including Elmonica Elementary School, Five Oaks Middle School, and Westview High School.
Ownership History
Date
Name
Owned For
Owner Type
Purchase Details
Closed on
Aug 19, 2020
Sold by
Nunez Oscar and Quinard Ann M
Bought by
Tenorio Oscar Nunez and Quinard Ann Michele
Current Estimated Value
Purchase Details
Closed on
Oct 7, 2010
Sold by
Skaist Howard A and Skaist Lisa D
Bought by
Quinard Ann M and Nunez Oscar
Home Financials for this Owner
Home Financials are based on the most recent Mortgage that was taken out on this home.
Original Mortgage
$322,087
Outstanding Balance
$209,785
Interest Rate
4.25%
Mortgage Type
FHA
Estimated Equity
$584,889
Purchase Details
Closed on
Jun 19, 1996
Sold by
Wu David E and Kwak Miyoung
Bought by
Skaist Howard A and Skaist Lisa D
Home Financials for this Owner
Home Financials are based on the most recent Mortgage that was taken out on this home.
Original Mortgage
$165,000
Interest Rate
8.25%
Create a Home Valuation Report for This Property
The Home Valuation Report is an in-depth analysis detailing your home's value as well as a comparison with similar homes in the area
Home Values in the Area
Average Home Value in this Area
Purchase History
| Date | Buyer | Sale Price | Title Company |
|---|---|---|---|
| Tenorio Oscar Nunez | -- | None Available | |
| Quinard Ann M | $350,000 | Fidelity Natl Title Co Of Or | |
| Skaist Howard A | $245,000 | Transnation Title Insurance |
Source: Public Records
Mortgage History
| Date | Status | Borrower | Loan Amount |
|---|---|---|---|
| Open | Quinard Ann M | $322,087 | |
| Previous Owner | Skaist Howard A | $165,000 |
Source: Public Records
Tax History Compared to Growth
Tax History
| Year | Tax Paid | Tax Assessment Tax Assessment Total Assessment is a certain percentage of the fair market value that is determined by local assessors to be the total taxable value of land and additions on the property. | Land | Improvement |
|---|---|---|---|---|
| 2026 | $9,877 | $482,200 | -- | -- |
| 2025 | $9,877 | $468,160 | -- | -- |
| 2024 | $9,326 | $454,530 | -- | -- |
| 2023 | $9,326 | $441,300 | $0 | $0 |
| 2022 | $8,926 | $441,300 | $0 | $0 |
| 2021 | $8,613 | $415,980 | $0 | $0 |
| 2020 | $8,351 | $403,870 | $0 | $0 |
| 2019 | $8,087 | $392,110 | $0 | $0 |
| 2018 | $7,829 | $380,690 | $0 | $0 |
| 2017 | $7,537 | $369,610 | $0 | $0 |
| 2016 | $7,274 | $358,850 | $0 | $0 |
| 2015 | $6,995 | $348,400 | $0 | $0 |
| 2014 | $6,855 | $338,260 | $0 | $0 |
Source: Public Records
Map
Nearby Homes
- 122 NW 152nd Ave
- 2195 NW 160th Ave
- 16223 NW Ashfield Dr
- 15705 NW Barkton St
- 17629 NW Shady Fir Loop
- 606 SW Dillan Dr
- 17621 NW Shady Fir Loop Unit 65
- 1771 NW 143rd Ave Unit 40
- 1630 NW Eastbrook Ct Unit 439
- 16916 SW Whitley Way
- 17525 NW Shorewood Dr Unit 487
- 17555 NW Shorewood Dr Unit 497
- 871 Liberty Bell Dr Unit 474
- 17808 NW Pioneer Rd
- 17572 NW Shady Fir Loop Unit 24
- 0 SW Waterleaf Unit 557255533
- 1244 SW 160th Ave Unit 104
- 415 NW Kotrik Place
- 650 SW Meadow Dr Unit 211
- 650 SW Meadow Dr Unit 106
- 660 NW Altishin Place
- 700 NW Altishin Place
- 15959 NW Blueridge Dr
- 686 NW Pebblestone Ln
- 674 NW Pebblestone Ln
- 662 Pebblestone Ln
- 720 NW Altishin Place
- 698 Pebblestone Ln
- 650 Pebblestone Ln
- 698 NW Pebblestone Ln
- 710 NW Pebblestone Ln
- 16020 NW Elizabeth Ct
- 722 NW Pebblestone Ln
- 655 NW Altishin Place
- 655 NW Altishinpl
- 645 NW Altishin Place
- 695 NW Altishin Place
- 794 Pebblestone Ln
- 806 NW Pebblestone Ln
- 782 NW Pebblestone Ln