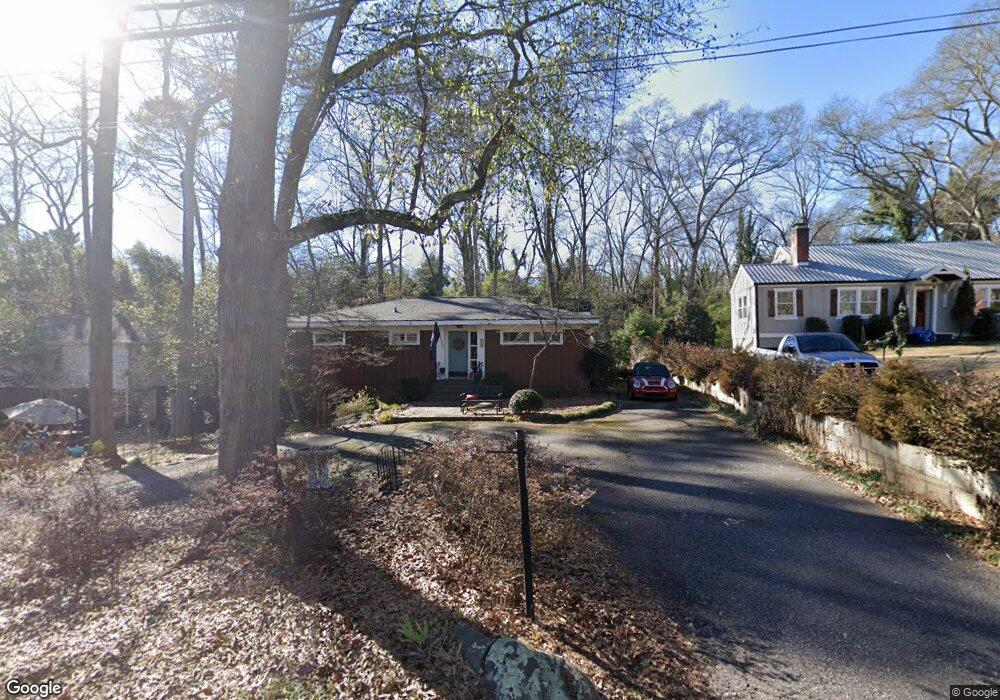
680 Pinecrest Dr Athens, GA 30605
Five Points NeighborhoodEstimated Value: $436,000 - $592,000
3
Beds
2
Baths
1,188
Sq Ft
$420/Sq Ft
Est. Value
About This Home
This home is located at 680 Pinecrest Dr, Athens, GA 30605 and is currently estimated at $499,499, approximately $420 per square foot. 680 Pinecrest Dr is a home located in Clarke County with nearby schools including Barrow Elementary School, Clarke Middle School, and Clarke Central High School.
Ownership History
Date
Name
Owned For
Owner Type
Purchase Details
Closed on
Oct 1, 2019
Sold by
Willis Anne Marie
Bought by
Willis Anne Marie and Willis Jon D
Current Estimated Value
Home Financials for this Owner
Home Financials are based on the most recent Mortgage that was taken out on this home.
Original Mortgage
$192,500
Outstanding Balance
$167,538
Interest Rate
3.4%
Mortgage Type
New Conventional
Estimated Equity
$331,961
Purchase Details
Closed on
Jul 23, 2018
Sold by
Dancz Steven L
Bought by
Willis Anne Marie
Purchase Details
Closed on
Nov 9, 2009
Sold by
Dancz Steven L
Bought by
Dancz Steven L
Home Financials for this Owner
Home Financials are based on the most recent Mortgage that was taken out on this home.
Original Mortgage
$120,000
Interest Rate
4.92%
Mortgage Type
New Conventional
Purchase Details
Closed on
Dec 30, 1998
Sold by
Dancz Roger L
Bought by
Dancz Steven L
Create a Home Valuation Report for This Property
The Home Valuation Report is an in-depth analysis detailing your home's value as well as a comparison with similar homes in the area
Home Values in the Area
Average Home Value in this Area
Purchase History
| Date | Buyer | Sale Price | Title Company |
|---|---|---|---|
| Willis Anne Marie | -- | -- | |
| Willis Anne Marie | $195,000 | -- | |
| Dancz Steven L | -- | -- | |
| Dancz Steven L | -- | -- |
Source: Public Records
Mortgage History
| Date | Status | Borrower | Loan Amount |
|---|---|---|---|
| Open | Willis Anne Marie | $192,500 | |
| Previous Owner | Dancz Steven L | $120,000 |
Source: Public Records
Tax History
| Year | Tax Paid | Tax Assessment Tax Assessment Total Assessment is a certain percentage of the fair market value that is determined by local assessors to be the total taxable value of land and additions on the property. | Land | Improvement |
|---|---|---|---|---|
| 2025 | $5,131 | $186,102 | $60,000 | $126,102 |
| 2024 | $5,131 | $173,628 | $60,000 | $113,628 |
| 2023 | $4,927 | $159,792 | $60,000 | $99,792 |
| 2022 | $3,828 | $130,005 | $44,000 | $86,005 |
| 2021 | $3,401 | $110,915 | $44,000 | $66,915 |
| 2020 | $3,211 | $105,268 | $40,000 | $65,268 |
| 2019 | $2,309 | $100,532 | $40,000 | $60,532 |
| 2018 | $3,315 | $97,650 | $40,000 | $57,650 |
| 2017 | $2,861 | $84,267 | $40,000 | $44,267 |
| 2016 | $2,917 | $85,914 | $40,000 | $45,914 |
| 2015 | $2,785 | $81,914 | $36,000 | $45,914 |
| 2014 | $2,789 | $81,914 | $36,000 | $45,914 |
Source: Public Records
Map
Nearby Homes
- 1697 S Milledge Ave
- 145 Riverdale Dr
- 760 E Campus Rd Unit 95
- 183 Parkway Dr
- 293 Southview Dr
- 655 E Campus Rd Unit 33
- 655 E Campus Rd
- 655 E Campus Rd Unit 12
- 115 Annes Ct
- 150 Gran Ellen Dr
- 1775 S Milledge Ave Unit 15
- 128 Habersham Dr
- 301 Parkway Dr
- 230 Milledge Terrace
- 1905 S Milledge Ave Unit 36
- 1905 S Milledge Ave Unit 5
- 390 Milledge Terrace
- 170 Northview Dr Unit 5
- 100 Davis St Unit 11
- 173 Westview Dr
- 670 Pinecrest Dr
- 690 Pinecrest Dr
- 669 Pinecrest Dr
- 697 Pinecrest Dr
- 665 Pinecrest Dr
- 675 Pinecrest Dr
- 660 Pinecrest Dr
- 155 Pinecrest Ct
- 1673-B S Milledge Ave
- 125 125 Pinecresr Ct
- 1683 S Milledge Ave
- 125 Pinecrest Ct
- 1679 S Milledge Ave
- 1685 S Milledge Ave Unit B
- 1685 S Milledge Ave Unit Main
- 1685 S Milledge Ave
- 635 Pinecrest Dr
- 6 Milledge Ct
- 650 Pinecrest Dr
- 115 Riverdale Dr
Your Personal Tour Guide
Ask me questions while you tour the home.