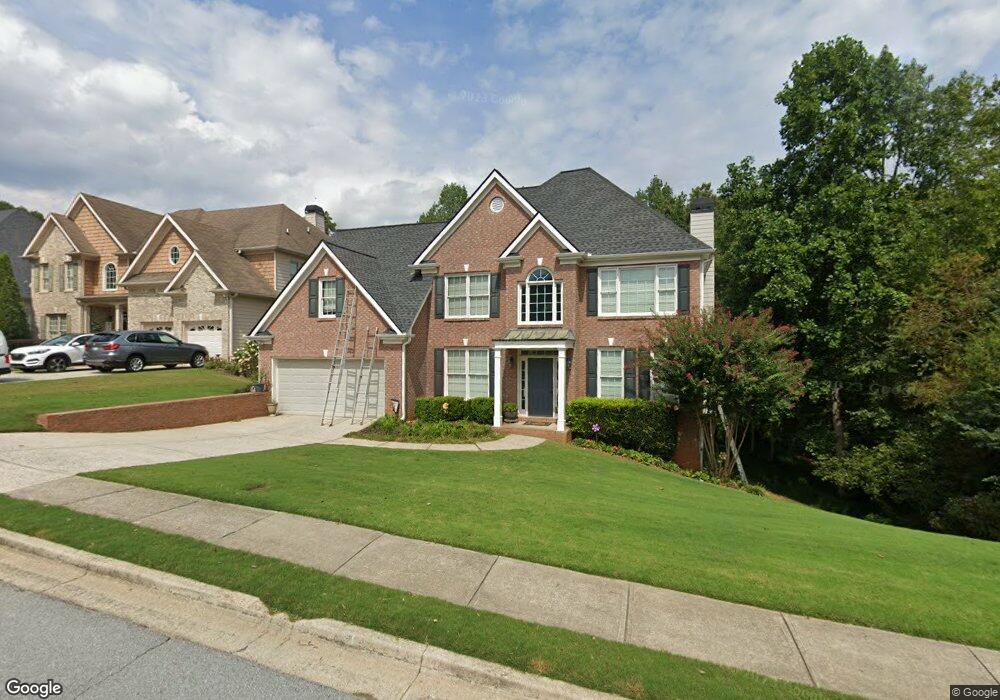
680 River Valley Dr Unit 4 Dacula, GA 30019
Estimated Value: $446,000 - $485,000
4
Beds
4
Baths
2,305
Sq Ft
$204/Sq Ft
Est. Value
About This Home
This home is located at 680 River Valley Dr Unit 4, Dacula, GA 30019 and is currently estimated at $470,666, approximately $204 per square foot. 680 River Valley Dr Unit 4 is a home located in Gwinnett County with nearby schools including Dacula Elementary School, Dacula Middle School, and Dacula High School.
Ownership History
Date
Name
Owned For
Owner Type
Purchase Details
Closed on
Aug 30, 2017
Sold by
Bollier Timothy
Bought by
Kines Clark T and Kines Megan D
Current Estimated Value
Home Financials for this Owner
Home Financials are based on the most recent Mortgage that was taken out on this home.
Original Mortgage
$283,765
Outstanding Balance
$238,993
Interest Rate
4.4%
Mortgage Type
FHA
Estimated Equity
$231,673
Purchase Details
Closed on
Jul 10, 2015
Sold by
Lukens Allen D
Bought by
Bollier Timothy and Bollier Krista
Home Financials for this Owner
Home Financials are based on the most recent Mortgage that was taken out on this home.
Original Mortgage
$199,500
Interest Rate
4.08%
Purchase Details
Closed on
Dec 2, 2004
Sold by
Risbergs Peter
Bought by
Lukens Allen D and Lukens Connie
Home Financials for this Owner
Home Financials are based on the most recent Mortgage that was taken out on this home.
Original Mortgage
$177,500
Interest Rate
5.67%
Create a Home Valuation Report for This Property
The Home Valuation Report is an in-depth analysis detailing your home's value as well as a comparison with similar homes in the area
Home Values in the Area
Average Home Value in this Area
Purchase History
| Date | Buyer | Sale Price | Title Company |
|---|---|---|---|
| Kines Clark T | $289,000 | -- | |
| Bollier Timothy | $210,000 | -- | |
| Lukens Allen D | -- | -- | |
| Lukens Allen D | $234,900 | -- |
Source: Public Records
Mortgage History
| Date | Status | Borrower | Loan Amount |
|---|---|---|---|
| Open | Kines Clark T | $283,765 | |
| Previous Owner | Lukens Allen D | $199,500 | |
| Previous Owner | Lukens Allen D | $177,500 |
Source: Public Records
Tax History Compared to Growth
Tax History
| Year | Tax Paid | Tax Assessment Tax Assessment Total Assessment is a certain percentage of the fair market value that is determined by local assessors to be the total taxable value of land and additions on the property. | Land | Improvement |
|---|---|---|---|---|
| 2025 | $5,262 | $187,320 | $30,000 | $157,320 |
| 2024 | $5,242 | $179,240 | $37,200 | $142,040 |
| 2023 | $5,242 | $185,080 | $33,600 | $151,480 |
| 2022 | $4,842 | $161,440 | $33,600 | $127,840 |
| 2021 | $4,069 | $121,320 | $22,400 | $98,920 |
| 2020 | $3,885 | $111,520 | $22,400 | $89,120 |
| 2019 | $3,653 | $106,520 | $22,400 | $84,120 |
| 2018 | $3,658 | $106,520 | $22,400 | $84,120 |
| 2016 | $3,239 | $82,480 | $16,000 | $66,480 |
| 2015 | $3,062 | $82,480 | $16,000 | $66,480 |
| 2014 | -- | $85,000 | $16,000 | $69,000 |
Source: Public Records
Map
Nearby Homes
- 638 Glen Valley Way
- 2422 Oak Bluff Dr
- 2681 Conifer Green Way
- 2467 Bittersweet Cir
- 675 Timber Ives Dr
- 1200 Evergreen Oak Way
- 1925 Heatherton Rd Unit 1
- 933 White Aster Ct
- 2713 Misty Rock Cove
- 1090 River Valley Dr
- 2674 Misty Rock Cove
- 2905 The Terraces Way
- 2070 Heatherton Rd
- 2933 Misty Rock Cove
- 1954 Acorn Ln
- 894 Fairview Club Cir Unit 2
- 680 River Valley Dr
- 670 River Valley Dr
- 660 River Valley Dr
- 767 Laurel West Ct Unit 4
- 767 Laurel Ct W
- 675 River Valley Dr
- 650 River Valley Dr
- 665 River Valley Dr Unit 4
- 757 Laurel West Ct Unit 4
- 754 Laurel West Ct Unit 4
- 640 River Valley Dr Unit 4
- 655 River Valley Dr
- 747 Laurel West Ct Unit 4
- 747 Laurel Ct W
- 771 Laurel West Ln Unit 4
- 744 Laurel Ct W
- 744 Laurel West Ct Unit 4
- 630 River Valley Dr
- 737 Laurel Ct W
- 737 Laurel West Ct Unit 4