680 Sacre Ln N Monmouth, OR 97361
Estimated Value: $409,000 - $437,000
3
Beds
2
Baths
1,512
Sq Ft
$279/Sq Ft
Est. Value
About This Home
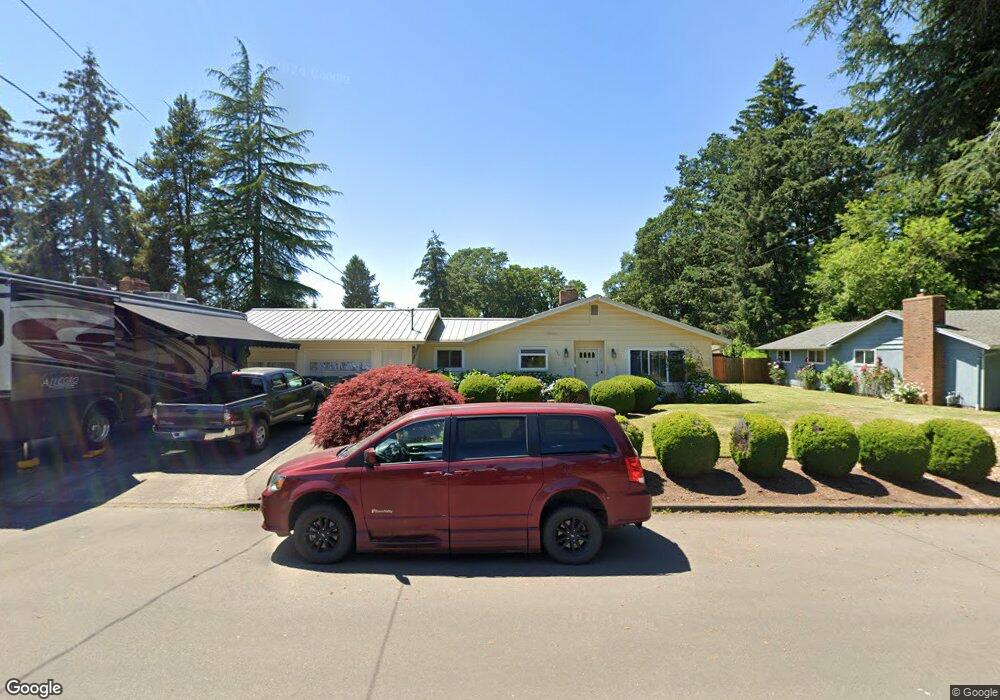
This home is located at 680 Sacre Ln N, Monmouth, OR 97361 and is currently estimated at $421,300, approximately $278 per square foot. 680 Sacre Ln N is a home located in Polk County with nearby schools including Monmouth Elementary School, Talmadge Middle School, and Central High School.
Ownership History
Date
Name
Owned For
Owner Type
Purchase Details
Closed on
Sep 27, 2021
Sold by
Fanene Liora Kehaulani and Hunter Shon Kimo
Bought by
Fanene Lianne
Current Estimated Value
Purchase Details
Closed on
Aug 26, 2021
Sold by
Fanene Lianne and Estate Of Linette Hunter
Bought by
Fanene Lianne and Fanene Liora Kehaulani
Purchase Details
Closed on
Aug 5, 2021
Sold by
Hunter Samuel
Bought by
Fanene Lianne
Purchase Details
Closed on
May 14, 2012
Sold by
Hunter Samuel and Hunter Linette
Bought by
Hunter Samuel and Hunter Linette
Purchase Details
Closed on
May 11, 2004
Sold by
Hunter Samuel
Bought by
Hunter Samuel and Hunter Linette
Home Financials for this Owner
Home Financials are based on the most recent Mortgage that was taken out on this home.
Original Mortgage
$129,800
Interest Rate
5.5%
Mortgage Type
New Conventional
Create a Home Valuation Report for This Property
The Home Valuation Report is an in-depth analysis detailing your home's value as well as a comparison with similar homes in the area
Home Values in the Area
Average Home Value in this Area
Purchase History
| Date | Buyer | Sale Price | Title Company |
|---|---|---|---|
| Fanene Lianne | -- | None Available | |
| Fanene Lianne | -- | None Available | |
| Fanene Lianne | -- | None Available | |
| Hunter Samuel | -- | None Available | |
| Hunter Samuel | -- | Lawyers Title Ins |
Source: Public Records
Mortgage History
| Date | Status | Borrower | Loan Amount |
|---|---|---|---|
| Previous Owner | Hunter Samuel | $129,800 |
Source: Public Records
Tax History Compared to Growth
Tax History
| Year | Tax Paid | Tax Assessment Tax Assessment Total Assessment is a certain percentage of the fair market value that is determined by local assessors to be the total taxable value of land and additions on the property. | Land | Improvement |
|---|---|---|---|---|
| 2025 | $3,270 | $197,140 | $58,290 | $138,850 |
| 2024 | $3,270 | $191,400 | $56,590 | $134,810 |
| 2023 | $3,405 | $185,830 | $54,940 | $130,890 |
| 2022 | $3,066 | $180,420 | $53,340 | $127,080 |
| 2021 | $3,031 | $175,170 | $51,780 | $123,390 |
| 2020 | $2,911 | $170,070 | $50,270 | $119,800 |
| 2019 | $2,826 | $165,120 | $48,810 | $116,310 |
| 2018 | $2,729 | $160,320 | $47,390 | $112,930 |
| 2017 | $2,714 | $155,660 | $46,010 | $109,650 |
| 2016 | $2,772 | $151,130 | $44,670 | $106,460 |
| 2015 | $2,650 | $146,730 | $43,370 | $103,360 |
| 2014 | $2,591 | $142,460 | $42,110 | $100,350 |
Source: Public Records
Map
Nearby Homes
- 555 High St N
- 751 Catron St N
- 0 Catron St N
- 1082 Alberta Ave E
- 858 Main St E
- 1329 Price Ln E
- 348 Main St E
- 191 Catron St S
- 9650 Hoffman Rd
- 141 S 17th St Unit 61 St
- 141 S 17th St Unit 70 St
- 309 Atwater St S
- 141 17th (#7) St S Unit 7
- 101 Edwards Rd S Unit 10-B Rd S
- 151 Edwards (#46) Rd S Unit 46
- 151 S Edwards (151) Rd
- 235 Edwards (#104) Rd S Unit 104
- 271 Clay St E
- 277 Edwards Rd S
- 277 Edwards Rd S Unit 133
- 650 Sacre Ln N
- 700 Sacre Ln N
- 683 Craven St N
- 711 Craven St N
- 651 Craven St N
- 620 Sacre Ln N
- 653 Sacre Ln N
- 912 Caroline Way E
- 758 Sacre Ln N
- 733 Sacre Ln N
- 757 Craven St N
- 623 Craven St N
- 615 Sacre Ln N
- 920 Caroline Way E
- 714 Craven St N
- 923 Caroline Way E
- 604 Sacre Ln N
- 770 Sacre Ln N
- 684 Craven St N
- 916 Margaret St E