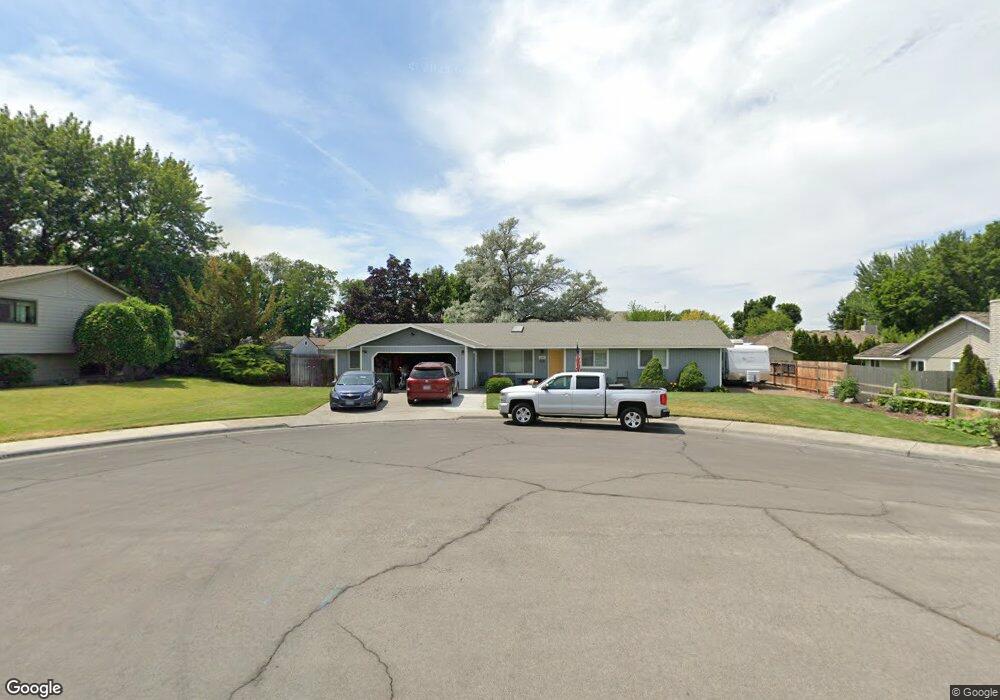
680 SE Pine Ct Hermiston, OR 97838
Estimated Value: $332,000 - $373,000
4
Beds
2
Baths
1,837
Sq Ft
$191/Sq Ft
Est. Value
About This Home
This home is located at 680 SE Pine Ct, Hermiston, OR 97838 and is currently estimated at $350,841, approximately $190 per square foot. 680 SE Pine Ct is a home located in Umatilla County with nearby schools including Highland Hills Elementary School, Sandstone Middle School, and Hermiston High School.
Ownership History
Date
Name
Owned For
Owner Type
Purchase Details
Closed on
May 5, 2016
Sold by
Godier John W
Bought by
Jundt James M and Jundt Jamie L
Current Estimated Value
Purchase Details
Closed on
Feb 13, 2013
Sold by
Oregon Housing & Community Services
Bought by
Godier John W
Home Financials for this Owner
Home Financials are based on the most recent Mortgage that was taken out on this home.
Original Mortgage
$162,011
Interest Rate
3.36%
Mortgage Type
FHA
Purchase Details
Closed on
Nov 7, 2012
Sold by
Stirnweis Yvonne
Bought by
Oregon Affordable Housing Assistance Cor
Purchase Details
Closed on
Nov 21, 2008
Sold by
Hopkins Bryan L and Hopkins Rebecca A
Bought by
Stirnweis Yvonne F
Home Financials for this Owner
Home Financials are based on the most recent Mortgage that was taken out on this home.
Original Mortgage
$171,938
Interest Rate
5.9%
Mortgage Type
New Conventional
Create a Home Valuation Report for This Property
The Home Valuation Report is an in-depth analysis detailing your home's value as well as a comparison with similar homes in the area
Home Values in the Area
Average Home Value in this Area
Purchase History
| Date | Buyer | Sale Price | Title Company |
|---|---|---|---|
| Jundt James M | $155,000 | Amerititle | |
| Godier John W | $165,000 | Amerititle | |
| Oregon Affordable Housing Assistance Cor | $148,750 | Amerititle | |
| Stirnweis Yvonne F | $168,000 | Amerititle |
Source: Public Records
Mortgage History
| Date | Status | Borrower | Loan Amount |
|---|---|---|---|
| Previous Owner | Godier John W | $162,011 | |
| Previous Owner | Stirnweis Yvonne F | $171,938 |
Source: Public Records
Tax History
| Year | Tax Paid | Tax Assessment Tax Assessment Total Assessment is a certain percentage of the fair market value that is determined by local assessors to be the total taxable value of land and additions on the property. | Land | Improvement |
|---|---|---|---|---|
| 2025 | $4,595 | $221,340 | $51,650 | $169,690 |
| 2023 | $4,496 | $208,650 | $48,690 | $159,960 |
| 2022 | $4,223 | $202,580 | $0 | $0 |
| 2021 | $4,232 | $196,680 | $45,890 | $150,790 |
| 2020 | $3,873 | $190,960 | $44,550 | $146,410 |
| 2018 | $3,614 | $180,000 | $42,000 | $138,000 |
| 2017 | $3,522 | $174,760 | $40,780 | $133,980 |
| 2016 | $3,105 | $158,850 | $41,350 | $117,500 |
| 2015 | $3,041 | $169,670 | $39,590 | $130,080 |
| 2014 | $3,129 | $169,670 | $39,590 | $130,080 |
Source: Public Records
Map
Nearby Homes
- 821 SE 9th Dr
- 325 SE 9th Dr
- 820 E Pine Ave
- 305 SE 9th Dr
- 337 E Highland Ave
- 1035 E Tamarack Ave
- 832 E Main St
- 994 E Hurlburt Ave
- 885 E Kinsley Ave
- 873 E Kinsley Ave
- 876 E Kinsley Ave
- 872 E Kinsley Ave
- 125 NE 8th St
- 593 SW Cottonwood Dr
- 416 SW Desert Sky Dr
- 1115 E Hurlburt Ave
- 1275 SE Kimber
- 1021 SE Columbia Dr
- 1291 SE 9th St
- 1290 E Highland Ave
- 680 SE Pine Ct
- 685 SE 9th Dr
- 630 SE Pine Ct
- 645 SE 9th St
- 695 E Pine Ct
- 695 E Pine Ct
- 630 E Pine Ct
- 665 E Pine Ct
- 610 E Pine Ct
- 645 E Pine Ct
- 915 E Highland Ave
- 905 E Highland Ave
- 900 E Pine Ave
- 925 E Highland Ave
- 870 E Quince Ave
- 730 SE 9th Dr
- 865 E Quince Ave
- 680 SE 9th Dr
- 750 SE 9th Dr
- 910 E Pine Ave
Your Personal Tour Guide
Ask me questions while you tour the home.