6800 E 400 N Grovertown, IN 46531
Estimated Value: $208,023 - $288,000
2
Beds
1
Bath
1,496
Sq Ft
$172/Sq Ft
Est. Value
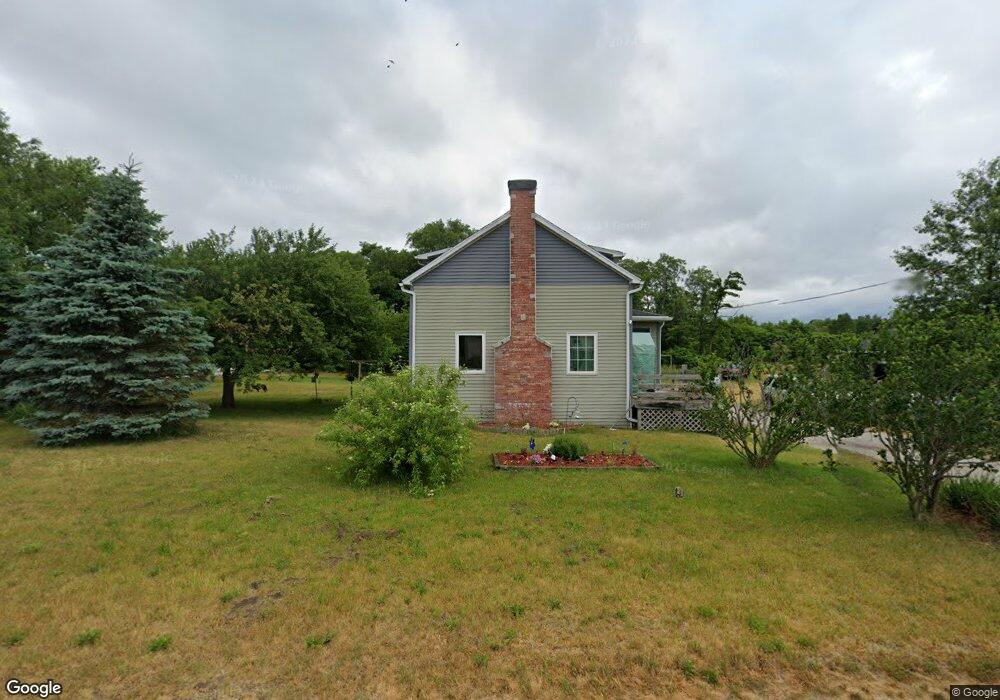
About This Home
This home is located at 6800 E 400 N, Grovertown, IN 46531 and is currently estimated at $257,008, approximately $171 per square foot. 6800 E 400 N is a home located in Starke County with nearby schools including Oregon-Davis Elementary School and Oregon-Davis Junior/Senior High School.
Ownership History
Date
Name
Owned For
Owner Type
Purchase Details
Closed on
May 1, 2017
Sold by
Richard Dollahan
Bought by
Samuel Dollahan Jr
Current Estimated Value
Home Financials for this Owner
Home Financials are based on the most recent Mortgage that was taken out on this home.
Original Mortgage
$65,000
Outstanding Balance
$53,077
Interest Rate
3.89%
Mortgage Type
Land Contract Argmt. Of Sale
Estimated Equity
$203,931
Purchase Details
Closed on
Sep 25, 2013
Sold by
Dollahan Yvonne K and Estate Of Charles E Dollahan S
Bought by
Dollahan Richard
Create a Home Valuation Report for This Property
The Home Valuation Report is an in-depth analysis detailing your home's value as well as a comparison with similar homes in the area
Purchase History
| Date | Buyer | Sale Price | Title Company |
|---|---|---|---|
| Samuel Dollahan Jr | $312,000 | -- | |
| Dollahan Samuel | $312,000 | -- | |
| Dollahan Richard | -- | None Available |
Source: Public Records
Mortgage History
| Date | Status | Borrower | Loan Amount |
|---|---|---|---|
| Open | Dollahan Samuel | $65,000 |
Source: Public Records
Tax History
| Year | Tax Paid | Tax Assessment Tax Assessment Total Assessment is a certain percentage of the fair market value that is determined by local assessors to be the total taxable value of land and additions on the property. | Land | Improvement |
|---|---|---|---|---|
| 2025 | $732 | $114,500 | $32,000 | $82,500 |
| 2024 | $732 | $113,200 | $31,800 | $81,400 |
| 2023 | $679 | $103,200 | $28,200 | $75,000 |
| 2022 | $641 | $95,500 | $24,300 | $71,200 |
| 2021 | $625 | $80,400 | $22,700 | $57,700 |
| 2020 | $655 | $72,900 | $22,600 | $50,300 |
| 2019 | $651 | $73,400 | $24,000 | $49,400 |
| 2018 | $510 | $64,900 | $19,400 | $45,500 |
| 2017 | $464 | $62,900 | $19,600 | $43,300 |
| 2016 | $513 | $62,600 | $19,800 | $42,800 |
| 2014 | $402 | $47,100 | $20,000 | $27,100 |
| 2013 | $379 | $46,500 | $19,300 | $27,200 |
Source: Public Records
Map
Nearby Homes
Your Personal Tour Guide
Ask me questions while you tour the home.