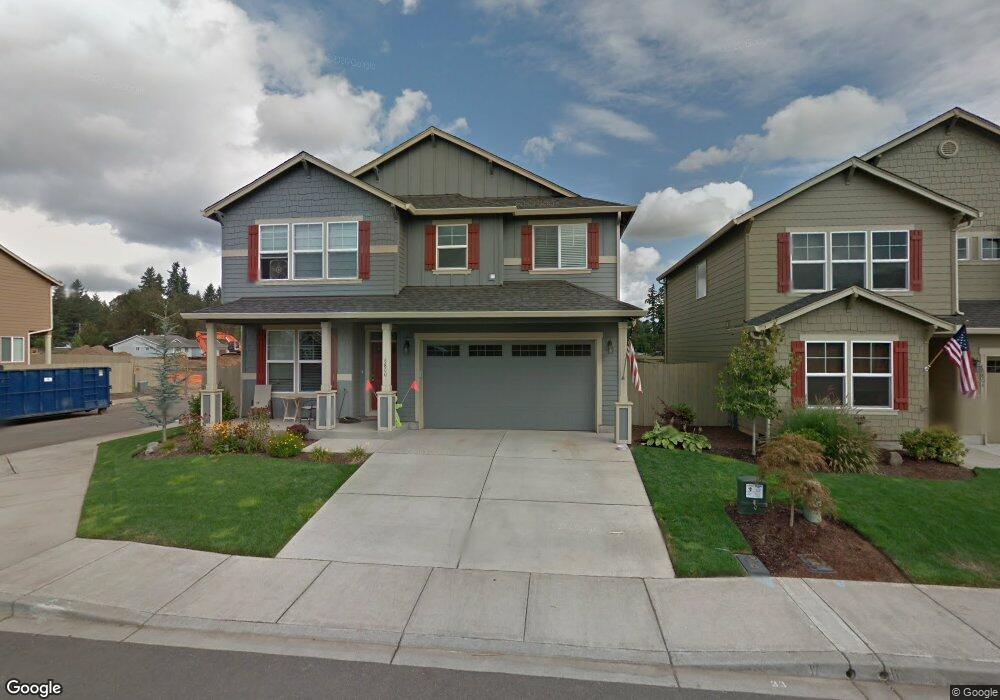
6800 NE 106th St Unit VG 33 Vancouver, WA 98686
Estimated Value: $590,000 - $665,000
3
Beds
3
Baths
2,587
Sq Ft
$241/Sq Ft
Est. Value
About This Home
This home is located at 6800 NE 106th St Unit VG 33, Vancouver, WA 98686 and is currently estimated at $624,298, approximately $241 per square foot. 6800 NE 106th St Unit VG 33 is a home located in Clark County with nearby schools including Pleasant Valley Primary School, Pleasant Valley Middle School, and Prairie High School.
Ownership History
Date
Name
Owned For
Owner Type
Purchase Details
Closed on
Jan 6, 2017
Sold by
Mcharg Paul
Bought by
Mcharg Stephanie
Current Estimated Value
Purchase Details
Closed on
Aug 18, 2009
Sold by
Vog Llc
Bought by
Mcharg Paul and Mcharg Stephanie
Home Financials for this Owner
Home Financials are based on the most recent Mortgage that was taken out on this home.
Original Mortgage
$270,902
Outstanding Balance
$175,545
Interest Rate
5.09%
Mortgage Type
FHA
Estimated Equity
$448,753
Purchase Details
Closed on
May 22, 2009
Sold by
Gg One Inc
Bought by
Vog Llc
Create a Home Valuation Report for This Property
The Home Valuation Report is an in-depth analysis detailing your home's value as well as a comparison with similar homes in the area
Home Values in the Area
Average Home Value in this Area
Purchase History
| Date | Buyer | Sale Price | Title Company |
|---|---|---|---|
| Mcharg Stephanie | -- | None Available | |
| Mcharg Paul | $275,900 | Fidelity National Title | |
| Vog Llc | -- | First American Title |
Source: Public Records
Mortgage History
| Date | Status | Borrower | Loan Amount |
|---|---|---|---|
| Open | Mcharg Paul | $270,902 |
Source: Public Records
Tax History Compared to Growth
Tax History
| Year | Tax Paid | Tax Assessment Tax Assessment Total Assessment is a certain percentage of the fair market value that is determined by local assessors to be the total taxable value of land and additions on the property. | Land | Improvement |
|---|---|---|---|---|
| 2025 | $4,596 | $596,493 | $192,000 | $404,493 |
| 2024 | $4,180 | $536,810 | $192,000 | $344,810 |
| 2023 | $4,433 | $583,181 | $192,000 | $391,181 |
| 2022 | $4,217 | $529,997 | $192,000 | $337,997 |
| 2021 | $4,331 | $457,537 | $144,375 | $313,162 |
| 2020 | $4,223 | $426,141 | $132,825 | $293,316 |
| 2019 | $3,670 | $404,567 | $132,825 | $271,742 |
| 2018 | $4,362 | $393,061 | $0 | $0 |
| 2017 | $3,775 | $356,388 | $0 | $0 |
| 2016 | $3,684 | $329,851 | $0 | $0 |
| 2015 | $3,760 | $295,988 | $0 | $0 |
| 2014 | -- | $285,620 | $0 | $0 |
| 2013 | -- | $258,353 | $0 | $0 |
Source: Public Records
Map
Nearby Homes
- 6908 NE 106th St
- 6617 NE 107th St
- 10501 NE 68th Ave
- 11103 NE Saint Johns Rd
- 11303 NE 68th Ave
- 11009 NE 62nd Place
- 10917 NE 64th Ct
- 11015 NE 64th Ct Unit Lot 10
- 11007 NE 64th Ct Unit Lot 8
- 11101 NE 64th Ct Unit Lot 14
- 6307 NE Wilding Rd
- 5404 NE 111th St
- 5602 NE 102nd St
- 11005 NE 55th Ave
- 11013 NE 55th Ave
- 11001 NE 55th Ave
- 11012 NE 55th Ave
- 11012 NE 55th Ave Unit 23
- 9700 NE 59th Ave
- 9311 NE 72nd Ave
- 6800 NE 106th St
- 6804 NE 106th St
- 10615 NE 68th Ave
- 10615 NE 68th Ave Unit 6
- 10517 NE 68th Ave
- 6716 NE 106th St
- 6808 NE 106th St
- 10619 NE 68th Ave
- 10518 NE 69th Ave
- 6711 NE 107th St
- 6711 NE 107th St
- 10516 NE 68th Ave
- 10513 NE 68th Ave
- 10514 NE 69th Ave
- 6810 NE 106th St
- 10701 NE 68th Ave
- 10512 NE 68th Ave Unit VG 74
- 6712 NE 106th St
- 6712 NE 106th St Unit VG 35
- 6707 NE 107th St