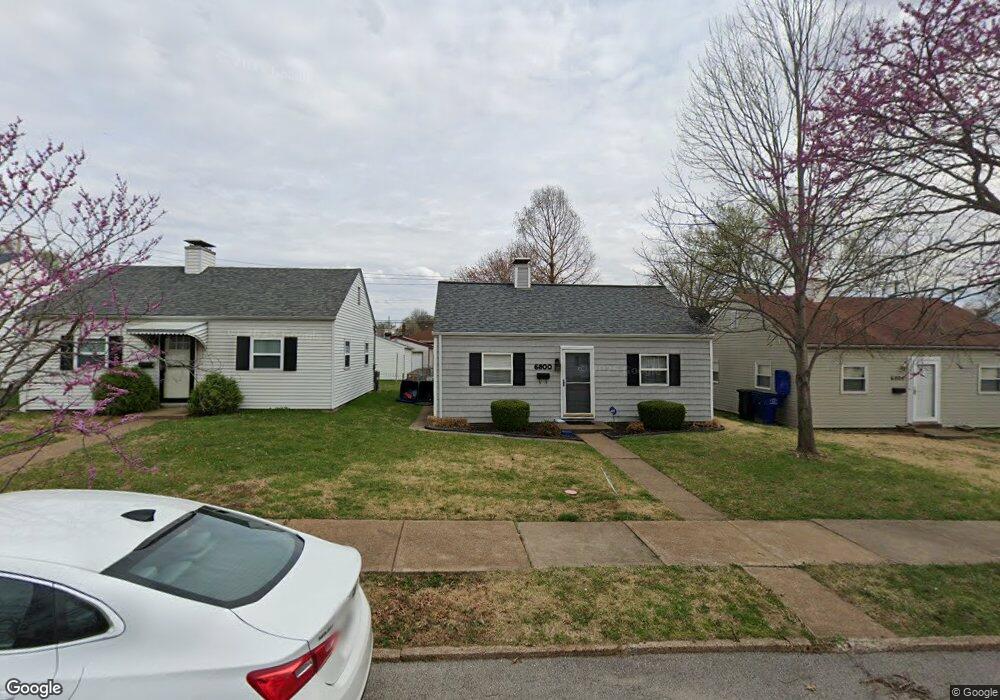
6800 Wanda Ave Saint Louis, MO 63116
Boulevard Heights NeighborhoodEstimated Value: $122,000 - $198,000
2
Beds
1
Bath
1,344
Sq Ft
$121/Sq Ft
Est. Value
About This Home
This home is located at 6800 Wanda Ave, Saint Louis, MO 63116 and is currently estimated at $163,089, approximately $121 per square foot. 6800 Wanda Ave is a home located in St. Louis City with nearby schools including Woerner Elementary School, Long International Middle School, and Roosevelt High School.
Ownership History
Date
Name
Owned For
Owner Type
Purchase Details
Closed on
Oct 30, 2008
Sold by
Root Justin
Bought by
Bourland Jennifer L
Current Estimated Value
Home Financials for this Owner
Home Financials are based on the most recent Mortgage that was taken out on this home.
Original Mortgage
$78,859
Outstanding Balance
$51,765
Interest Rate
6.08%
Mortgage Type
FHA
Estimated Equity
$111,324
Purchase Details
Closed on
Dec 14, 2006
Sold by
Transitions Inc
Bought by
Root Justin
Home Financials for this Owner
Home Financials are based on the most recent Mortgage that was taken out on this home.
Original Mortgage
$49,500
Interest Rate
6.31%
Mortgage Type
Purchase Money Mortgage
Purchase Details
Closed on
Oct 12, 2006
Sold by
Neumyer Audrey Karen
Bought by
Transitions Inc
Purchase Details
Closed on
Aug 11, 1998
Sold by
Frederick Laverne V
Bought by
Frederick Kenneth H and Frederick Sandra
Create a Home Valuation Report for This Property
The Home Valuation Report is an in-depth analysis detailing your home's value as well as a comparison with similar homes in the area
Home Values in the Area
Average Home Value in this Area
Purchase History
| Date | Buyer | Sale Price | Title Company |
|---|---|---|---|
| Bourland Jennifer L | -- | None Available | |
| Root Justin | -- | Ctc | |
| Transitions Inc | -- | Clt | |
| Frederick Kenneth H | -- | -- |
Source: Public Records
Mortgage History
| Date | Status | Borrower | Loan Amount |
|---|---|---|---|
| Open | Bourland Jennifer L | $78,859 | |
| Previous Owner | Root Justin | $49,500 |
Source: Public Records
Tax History Compared to Growth
Tax History
| Year | Tax Paid | Tax Assessment Tax Assessment Total Assessment is a certain percentage of the fair market value that is determined by local assessors to be the total taxable value of land and additions on the property. | Land | Improvement |
|---|---|---|---|---|
| 2025 | $1,306 | $17,070 | $3,250 | $13,820 |
| 2024 | $1,243 | $15,270 | $3,250 | $12,020 |
| 2023 | $1,243 | $15,270 | $3,250 | $12,020 |
| 2022 | $1,200 | $14,180 | $3,250 | $10,930 |
| 2021 | $1,198 | $14,180 | $3,250 | $10,930 |
| 2020 | $1,072 | $12,750 | $3,250 | $9,500 |
| 2019 | $1,069 | $12,750 | $3,250 | $9,500 |
| 2018 | $999 | $11,540 | $2,890 | $8,650 |
| 2017 | $982 | $11,530 | $2,890 | $8,650 |
| 2016 | $1,009 | $11,700 | $2,890 | $8,820 |
| 2015 | $916 | $11,710 | $2,890 | $8,820 |
| 2014 | $918 | $11,710 | $2,890 | $8,820 |
| 2013 | -- | $11,740 | $2,890 | $8,850 |
Source: Public Records
Map
Nearby Homes
- 6815 Parkwood Place
- 6833 Wanda Ave
- 4323 Loughborough Ave
- 6613 Parkwood Place
- 4311 Loughborough Ave
- 6522 Parkwood Place
- 4329 Alma Ave
- 4317 Alma Ave
- 6432 Wanda Ave
- 6509 Morganford Rd
- 4138 Loughborough Ave
- 4570-4572 Loughborough Ave
- 6910 Salzburger Ave
- 4114 Alma Ave
- 4615 Quincy St
- 4317 Koeln Ave
- 6623 Leona St
- 6146 Morganford Rd
- 4122 Federer St
- 4102 Upton Ct
- 6804 Wanda Ave
- 6728 Wanda Ave
- 6808 Wanda Ave
- 6724 Wanda Ave
- 6812 Wanda Ave
- 6720 Wanda Ave
- 6805 Parkwood Place
- 6801 Parkwood Place
- 6807 Parkwood Place
- 6816 Wanda Ave
- 6727 Parkwood Place
- 6809 Parkwood Place
- 6716 Wanda Ave
- 6723 Parkwood Place
- 6805 Wanda Ave
- 6801 Wanda Ave
- 6820 Wanda Ave
- 6809 Wanda Ave
- 6729 Wanda Ave
- 6712 Wanda Ave