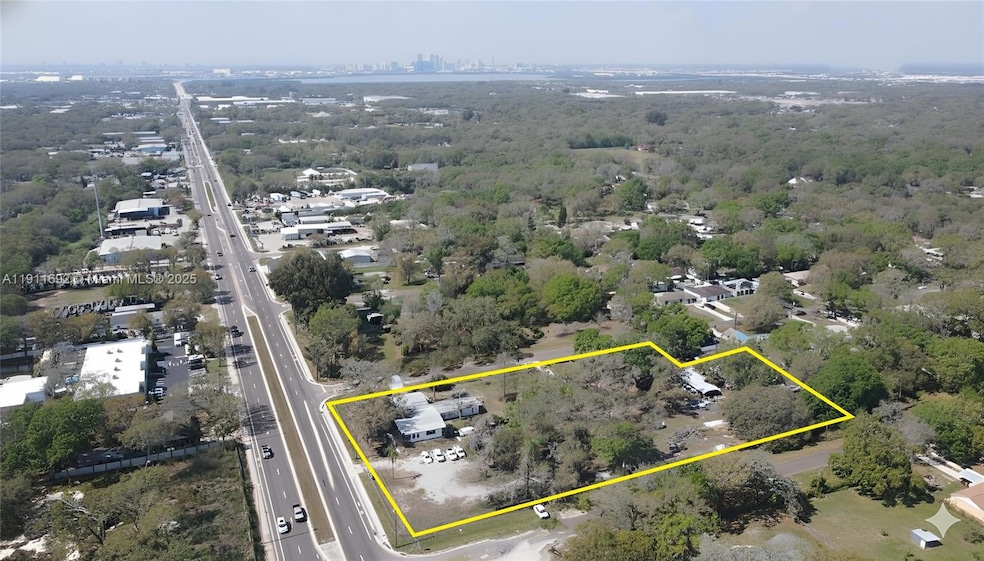
6802 Causeway Blvd Tampa, FL 33619
Great Palm River Point NeighborhoodEstimated payment $15,321/month
About This Lot
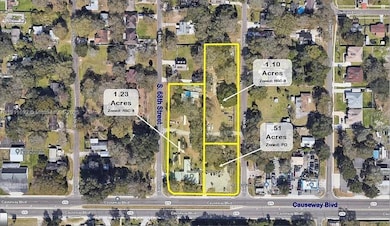
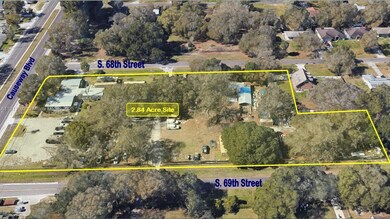
Rare 2.84-acre PD-zoned site at 6802 Causeway Blvd, Tampa, FL, with 3 parcels (16 lots) and ±250 ft frontage. Flexible zoning allows commercial, light industrial, IOS, or residential redevelopment. Level, cleared site with public water (septic required) and existing 3,993 SF structure. Heavy traffic exposure (21,000 VPD) and prime location near I-75, US-301, Selmon Expressway, and Port of Tampa. Opportunity Zone benefits add strong investment potential.
Property Details
Property Type
- Land
Est. Annual Taxes
- $7,113
Lot Details
- 2.84 Acre Lot
- Lot Dimensions are 250x0
- Additional Parcels
- Property is zoned PD & RSC-9
Community Details
- No Home Owners Association
Listing and Financial Details
- Assessor Parcel Number 046200-0000
Map
Home Values in the Area
Average Home Value in this Area
Tax History
| Year | Tax Paid | Tax Assessment Tax Assessment Total Assessment is a certain percentage of the fair market value that is determined by local assessors to be the total taxable value of land and additions on the property. | Land | Improvement |
|---|---|---|---|---|
| 2024 | $7,113 | $460,553 | $176,375 | $284,178 |
| 2023 | $6,309 | $391,599 | $154,328 | $237,271 |
| 2022 | $5,985 | $400,793 | $132,281 | $268,512 |
| 2021 | $5,215 | $302,846 | $110,234 | $192,612 |
| 2020 | $3,244 | $175,271 | $74,959 | $100,312 |
| 2019 | $3,000 | $166,955 | $74,959 | $91,996 |
| 2018 | $2,647 | $133,943 | $0 | $0 |
| 2017 | $2,409 | $115,853 | $0 | $0 |
| 2016 | $829 | $68,189 | $0 | $0 |
| 2015 | $841 | $67,715 | $0 | $0 |
| 2014 | $824 | $67,178 | $0 | $0 |
| 2013 | -- | $66,185 | $0 | $0 |
Property History
| Date | Event | Price | List to Sale | Price per Sq Ft | Prior Sale |
|---|---|---|---|---|---|
| 11/10/2025 11/10/25 | For Sale | $2,800,000 | +229.4% | -- | |
| 04/02/2024 04/02/24 | Sold | $850,000 | -14.6% | $531 / Sq Ft | View Prior Sale |
| 09/28/2023 09/28/23 | Pending | -- | -- | -- | |
| 06/29/2023 06/29/23 | For Sale | $995,000 | 0.0% | $622 / Sq Ft | |
| 06/19/2023 06/19/23 | Pending | -- | -- | -- | |
| 03/22/2023 03/22/23 | For Sale | $995,000 | +240.2% | $622 / Sq Ft | |
| 08/17/2018 08/17/18 | Off Market | $292,500 | -- | -- | |
| 06/13/2016 06/13/16 | Sold | $292,500 | -25.9% | $183 / Sq Ft | View Prior Sale |
| 04/01/2016 04/01/16 | Pending | -- | -- | -- | |
| 04/18/2013 04/18/13 | For Sale | $395,000 | -- | $247 / Sq Ft |
Purchase History
| Date | Type | Sale Price | Title Company |
|---|---|---|---|
| Warranty Deed | $850,000 | American Home Title | |
| Deed | $292,500 | -- | |
| Interfamily Deed Transfer | -- | Attorney | |
| Quit Claim Deed | -- | -- |
Mortgage History
| Date | Status | Loan Amount | Loan Type |
|---|---|---|---|
| Open | $305,400 | Balloon |
Source: MIAMI REALTORS® MLS
MLS Number: A11911692
APN: U-26-29-19-1PQ-000003-00001.0
Disclaimer: Certain information contained herein is derived from information provided by parties other than Homes.com. All information provided is deemed reliable, but is not guaranteed to be accurate and should be independently verified.
![]() IDX information is provided exclusively for personal, non-commercial use, and may not be used for any purpose other than to identify prospective properties consumers may be interested in purchasing. Information is deemed reliable but not guaranteed.
IDX information is provided exclusively for personal, non-commercial use, and may not be used for any purpose other than to identify prospective properties consumers may be interested in purchasing. Information is deemed reliable but not guaranteed.
- 2416 S 67th St
- 2406 S 68th St
- 6605 24th Ave S
- 7010 S Sandhurst Dr
- 6511 24th Ave S
- 2067 Balfour Cir
- 2015 Wishing Well Way
- 3508 S 75th St
- 7620 32nd Ave S
- 7620 Dennison Dr
- 7102 Reindeer Rd
- 3709 Daisy Bloom Place
- 7614 35th Ave S
- 1716 Lancelot Loop
- 7412 Pearly Everlasting Ave
- 2008 S 58th St
- 3802 Daisy Bloom Place
- 2014 S 58th St
- 2001 S 58th St
- 7112 Robindale Rd
- 2603 S 70th St
- 2417 S 66th St
- 3651 Fulton Ferry Ln
- 3658 Fulton Ferry Ln
- 3693 Fulton Ferry Ln
- 6107 16th Ave S Unit 1
- 3928 Cat Mint St
- 4110 Romano Busciglio St
- 7234 Samuel Ivy Dr
- 7631 French Marigold Ave
- 2633 Azalea Garden Place
- 7020 Samuel Ivy Dr
- 4412 Summer Savory St
- 1332 Warrington Way
- 4329 Globe Thistle Dr
- 8003 Canterbury Lake Blvd
- 8733 Rooks Park Cir
- 9029 Egret Cove Cir
- 9042 Egret Cove Cir
- 4214 Hartford Lake Dr
