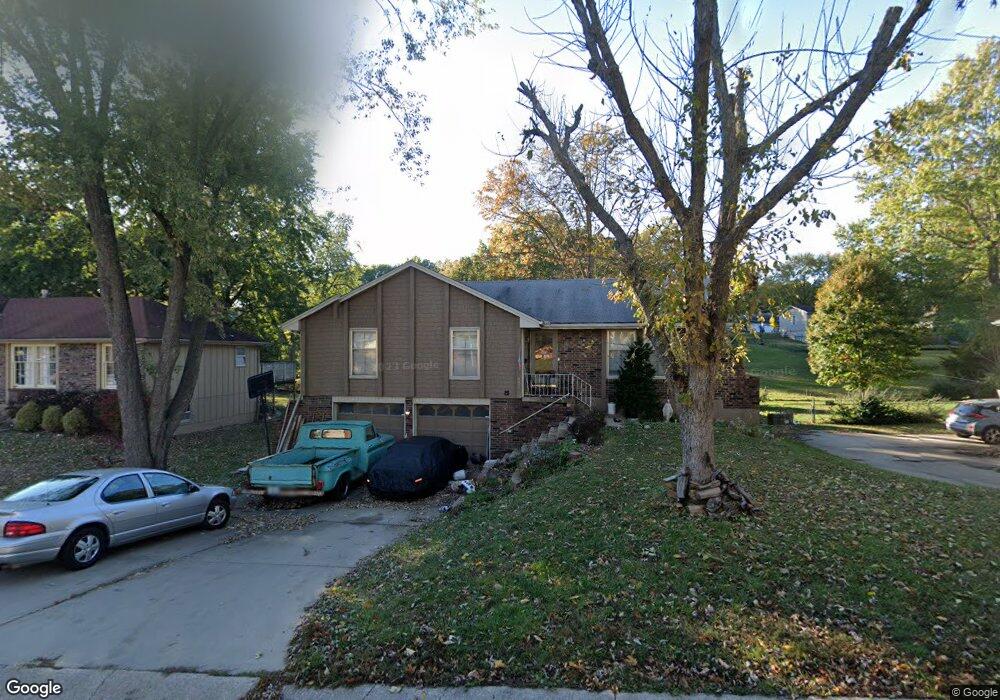
6804 Vermont Ave Raytown, MO 64133
Estimated Value: $232,961 - $264,000
3
Beds
2
Baths
1,312
Sq Ft
$189/Sq Ft
Est. Value
About This Home
This home is located at 6804 Vermont Ave, Raytown, MO 64133 and is currently estimated at $248,490, approximately $189 per square foot. 6804 Vermont Ave is a home located in Jackson County with nearby schools including Robinson Elementary School, Raytown Central Middle School, and Raytown South High School.
Ownership History
Date
Name
Owned For
Owner Type
Purchase Details
Closed on
Dec 29, 2008
Sold by
Tartaglia D Michael
Bought by
Tartaglia Jennifer J
Current Estimated Value
Purchase Details
Closed on
Jun 28, 2000
Sold by
Neff Eric
Bought by
Tartaglia Michael and Tartaglia Jennifer J
Home Financials for this Owner
Home Financials are based on the most recent Mortgage that was taken out on this home.
Original Mortgage
$89,928
Outstanding Balance
$32,230
Interest Rate
8.66%
Mortgage Type
FHA
Estimated Equity
$216,260
Purchase Details
Closed on
Jul 17, 1997
Sold by
Wilson Gary W and Wilson Denise M
Bought by
Neff Eric and Neff Heather L
Home Financials for this Owner
Home Financials are based on the most recent Mortgage that was taken out on this home.
Original Mortgage
$80,712
Interest Rate
7.72%
Mortgage Type
FHA
Create a Home Valuation Report for This Property
The Home Valuation Report is an in-depth analysis detailing your home's value as well as a comparison with similar homes in the area
Home Values in the Area
Average Home Value in this Area
Purchase History
| Date | Buyer | Sale Price | Title Company |
|---|---|---|---|
| Tartaglia Jennifer J | -- | None Available | |
| Tartaglia Michael | -- | Ati Title Company | |
| Neff Eric | -- | Chicago Title Insurance Co |
Source: Public Records
Mortgage History
| Date | Status | Borrower | Loan Amount |
|---|---|---|---|
| Open | Tartaglia Michael | $89,928 | |
| Previous Owner | Neff Eric | $80,712 |
Source: Public Records
Tax History Compared to Growth
Tax History
| Year | Tax Paid | Tax Assessment Tax Assessment Total Assessment is a certain percentage of the fair market value that is determined by local assessors to be the total taxable value of land and additions on the property. | Land | Improvement |
|---|---|---|---|---|
| 2025 | $3,058 | $30,404 | $4,815 | $25,589 |
| 2024 | $3,058 | $33,894 | $3,447 | $30,447 |
| 2023 | $3,037 | $33,894 | $2,757 | $31,137 |
| 2022 | $2,163 | $22,990 | $3,411 | $19,579 |
| 2021 | $2,170 | $22,990 | $3,411 | $19,579 |
| 2020 | $2,078 | $21,801 | $3,411 | $18,390 |
| 2019 | $2,066 | $21,801 | $3,411 | $18,390 |
| 2018 | $1,854 | $20,254 | $3,752 | $16,502 |
| 2017 | $1,797 | $20,254 | $3,752 | $16,502 |
| 2016 | $1,797 | $19,747 | $2,936 | $16,811 |
| 2014 | $1,764 | $19,171 | $2,850 | $16,321 |
Source: Public Records
Map
Nearby Homes
- 6828 Vermont Ave
- 6710 Woodson Rd
- 6812 Wildwood Dr
- 6716 Sterling Ave
- 6727 Harvard Ave
- 7007 Lakeshore Dr
- 6716 Appleton Ave
- 10800 Lakeview Rd
- 10920 E 71st Terrace
- 6423 Harris Ave
- 7200 Sterling Ave
- 6407 Harvard Ave
- 6410 Harvard Ave
- 6817 Lakeshore Dr
- 12801 Rickey Rd
- 6322 Norwood Ct
- 7236 Crisp Ave
- 6317 Harvard Ave
- 6619 Willow Ave
- 10501 E 69th St
- 6808 Vermont Ave
- 6800 Vermont Ave
- 6812 Vermont Ave
- 6809 Englewood Ave
- 6805 Vermont Ave
- 6811 Vermont Ave
- 6728 Vermont Ave
- 6817 Vermont Ave
- 6801 Vermont Ave
- 6813 Englewood Ave
- 6816 Vermont Ave
- 6801 Englewood Ave
- 6821 Vermont Ave
- 6724 Vermont Ave
- 6729 Vermont Ave
- 6817 Englewood Ave
- 6820 Vermont Ave
- 6723 Englewood Ave
- 6825 Vermont Ave