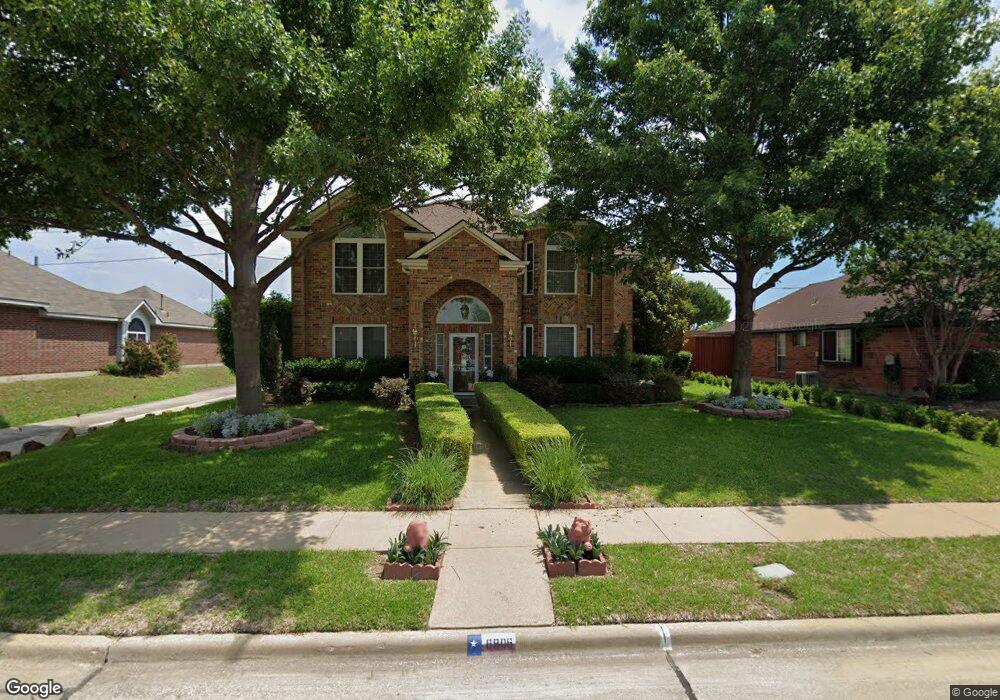
6806 Falcon St Rowlett, TX 75089
Springfield NeighborhoodEstimated Value: $375,000 - $440,000
4
Beds
3
Baths
2,627
Sq Ft
$158/Sq Ft
Est. Value
About This Home
This home is located at 6806 Falcon St, Rowlett, TX 75089 and is currently estimated at $413,865, approximately $157 per square foot. 6806 Falcon St is a home located in Dallas County with nearby schools including Harmony Science Academy - Garland, Harmony School of Innovation - Garland, and Wesleyan Christian Academy.
Ownership History
Date
Name
Owned For
Owner Type
Purchase Details
Closed on
Jul 31, 2025
Sold by
Foster Jesse Miller
Bought by
Foster Kay Nance
Current Estimated Value
Purchase Details
Closed on
Aug 20, 2015
Sold by
Foste Jesse Miller and Foster Kay Nance
Bought by
Foster Family Trust and Foster Jesse Miller
Purchase Details
Closed on
Jul 26, 2000
Sold by
Foster Kay Nance and Eakins Kay N
Bought by
Foster Jesse Miller
Purchase Details
Closed on
Nov 15, 1999
Sold by
Buford Richard Terrell and Buford Patricia
Bought by
Eakins Kay N
Home Financials for this Owner
Home Financials are based on the most recent Mortgage that was taken out on this home.
Original Mortgage
$124,400
Interest Rate
4.45%
Purchase Details
Closed on
Mar 28, 1994
Sold by
Voeller Leo S
Bought by
Buford Richard Terrell
Create a Home Valuation Report for This Property
The Home Valuation Report is an in-depth analysis detailing your home's value as well as a comparison with similar homes in the area
Home Values in the Area
Average Home Value in this Area
Purchase History
| Date | Buyer | Sale Price | Title Company |
|---|---|---|---|
| Foster Kay Nance | -- | None Listed On Document | |
| Miller Foster Jesse | -- | None Listed On Document | |
| Foster Family Trust | -- | None Available | |
| Foster Jesse Miller | -- | -- | |
| Eakins Kay N | -- | -- | |
| Buford Richard Terrell | -- | -- |
Source: Public Records
Mortgage History
| Date | Status | Borrower | Loan Amount |
|---|---|---|---|
| Previous Owner | Eakins Kay N | $124,400 | |
| Closed | Foster Jesse Miller | $0 |
Source: Public Records
Tax History Compared to Growth
Tax History
| Year | Tax Paid | Tax Assessment Tax Assessment Total Assessment is a certain percentage of the fair market value that is determined by local assessors to be the total taxable value of land and additions on the property. | Land | Improvement |
|---|---|---|---|---|
| 2025 | $1,724 | $453,890 | $70,000 | $383,890 |
| 2024 | $1,724 | $453,890 | $70,000 | $383,890 |
| 2023 | $1,724 | $420,880 | $70,000 | $350,880 |
| 2022 | $10,199 | $420,880 | $70,000 | $350,880 |
| 2021 | $8,290 | $316,700 | $55,000 | $261,700 |
| 2020 | $8,365 | $316,700 | $55,000 | $261,700 |
| 2019 | $9,101 | $316,700 | $55,000 | $261,700 |
| 2018 | $7,788 | $269,120 | $30,000 | $239,120 |
| 2017 | $7,810 | $269,120 | $30,000 | $239,120 |
| 2016 | $6,458 | $222,560 | $30,000 | $192,560 |
| 2015 | $3,244 | $185,000 | $26,000 | $159,000 |
| 2014 | $3,244 | $185,000 | $26,000 | $159,000 |
Source: Public Records
Map
Nearby Homes
- 6306 Debbie Cir
- 7005 Buckhorn Dr
- 2601 Daisy Ln
- 6317 Locust St
- 6613 Springmeadow Ln
- 6605 Bluebonnet Dr
- 6407 Redwood Ln
- 6017 Mimosa Ln
- 6518 Day Farm Ct
- 3422 Jonquil Ln
- 7202 Sand Pine Dr
- 3411 Beech St
- 2917 Hickox Rd
- 7305 Meadowwood Dr
- 2928 Hickox Rd
- 2413 Katherine Dr
- 3002 Toler Rd
- 2709 Planetree Dr
- 5905 Cedar Ln
- 6529 Bandalia Dr
- 6802 Falcon St
- 6810 Falcon St
- 6718 Falcon St
- 6409 Homewood Ave
- 6410 Debbie Cir
- 6714 Falcon St
- 6406 Debbie Cir
- 6405 Homewood Ave
- 6413 Debbie Cir
- 6417 Debbie Cir
- 6410 Homewood Ave
- 6710 Falcon St
- 6409 Debbie Cir
- 6402 Debbie Cir
- 6401 Homewood Ave
- 6406 Homewood Ave
- 6405 Debbie Cir
- 6706 Falcon St
- 6318 Debbie Cir
- 6317 Homewood Ave