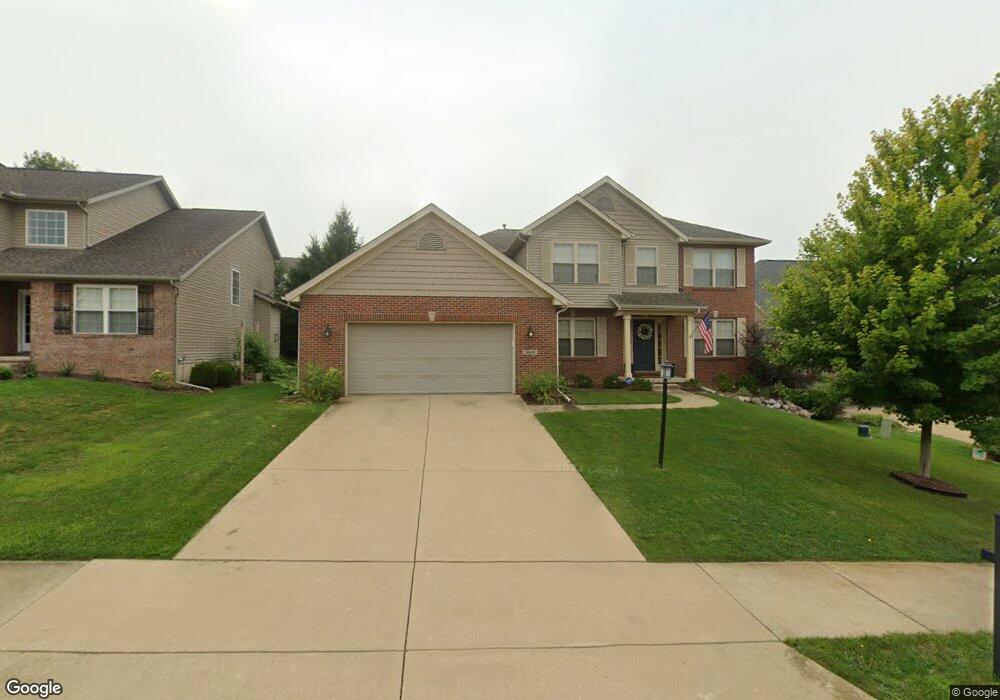
6806 N Iron Wood Dr Edwards, IL 61528
North Peoria NeighborhoodEstimated Value: $396,443 - $419,000
4
Beds
3
Baths
2,104
Sq Ft
$194/Sq Ft
Est. Value
About This Home
This home is located at 6806 N Iron Wood Dr, Edwards, IL 61528 and is currently estimated at $409,111, approximately $194 per square foot. 6806 N Iron Wood Dr is a home located in Peoria County with nearby schools including Ridgeview Elementary School, Dunlap Valley Middle School, and Dunlap High School.
Ownership History
Date
Name
Owned For
Owner Type
Purchase Details
Closed on
Aug 14, 2025
Sold by
Scheuermann Taylor and Scheuermann Sara
Bought by
Thomas Joseph and Thomas Laura Joseph
Current Estimated Value
Home Financials for this Owner
Home Financials are based on the most recent Mortgage that was taken out on this home.
Original Mortgage
$397,700
Outstanding Balance
$397,349
Interest Rate
6.63%
Mortgage Type
New Conventional
Estimated Equity
$11,762
Purchase Details
Closed on
Jun 1, 2020
Sold by
Lang Joseph A and Lang Jean E
Bought by
Scheuermann Taylor and Scheuermann Sara
Home Financials for this Owner
Home Financials are based on the most recent Mortgage that was taken out on this home.
Original Mortgage
$227,500
Interest Rate
3.2%
Mortgage Type
Credit Line Revolving
Purchase Details
Closed on
Jun 25, 2007
Bought by
Lang Joseph A and Lang Jean E
Create a Home Valuation Report for This Property
The Home Valuation Report is an in-depth analysis detailing your home's value as well as a comparison with similar homes in the area
Home Values in the Area
Average Home Value in this Area
Purchase History
| Date | Buyer | Sale Price | Title Company |
|---|---|---|---|
| Thomas Joseph | $410,000 | None Listed On Document | |
| Scheuermann Taylor | $247,500 | Heyl Royster Voelker & Allen | |
| Lang Joseph A | $269,900 | -- |
Source: Public Records
Mortgage History
| Date | Status | Borrower | Loan Amount |
|---|---|---|---|
| Open | Thomas Joseph | $397,700 | |
| Previous Owner | Scheuermann Taylor | $227,500 |
Source: Public Records
Tax History Compared to Growth
Tax History
| Year | Tax Paid | Tax Assessment Tax Assessment Total Assessment is a certain percentage of the fair market value that is determined by local assessors to be the total taxable value of land and additions on the property. | Land | Improvement |
|---|---|---|---|---|
| 2024 | $9,105 | $109,710 | $20,590 | $89,120 |
| 2023 | $8,299 | $99,740 | $18,720 | $81,020 |
| 2022 | $7,098 | $85,610 | $17,800 | $67,810 |
| 2021 | $6,876 | $82,320 | $17,120 | $65,200 |
| 2020 | $7,615 | $89,920 | $17,120 | $72,800 |
| 2019 | $7,599 | $89,920 | $17,120 | $72,800 |
| 2018 | $7,684 | $91,640 | $17,440 | $74,200 |
| 2017 | $7,869 | $93,510 | $17,800 | $75,710 |
| 2016 | $7,577 | $93,510 | $17,800 | $75,710 |
| 2015 | $7,355 | $89,920 | $17,120 | $72,800 |
| 2014 | $7,260 | $90,630 | $17,250 | $73,380 |
| 2013 | -- | $89,730 | $17,080 | $72,650 |
Source: Public Records
Map
Nearby Homes
- 6512 N Ironwood Dr
- 6505 N Ironwood Dr
- 6623 N Ironwood Dr
- 6521 N Ironwood Dr
- 7124 N Ironwood Dr
- 6426 Ironwood Dr
- 7027 N Buckeye Dr
- 6412 W Callahan Ct
- 6401 W Callahan Ct
- 6722 N Water Oak Dr
- 6810 N Water Oak Dr
- 6411 W Callahan Ct
- 6816 N Water Oak Dr
- 6419 Callahan Ct
- 6832 N Water Oak Dr
- 6501 W Callahan Ct
- 6908 N Water Oak Dr
- 6417 W Ironwood Dr
- 6509 Callahan Ct
- 6711 N Water Oak Dr
- 6812 N Iron Wood Dr
- 6426 N Ironwood Dr
- 6802 N Ironwood Dr
- 6811 N Iron Wood Dr
- 6802 N Iron Wood Dr
- 6816 N Iron Wood Dr
- 6803 N Iron Wood Dr
- 6717 N Buckeye Dr
- 6817 N Iron Wood Dr
- 6801 N Buckeye Dr
- 6711 N Buckeye Dr
- 6817 N Ironwood Dr
- 6800 N Iron Wood Dr
- 6807 N Buckeye Dr
- 6820 N Iron Wood Dr
- 6707 N Buckeye Dr
- 6813 N Buckeye Dr
- 6823 N Iron Wood Dr
- 6826 N Iron Wood Dr
- 6817 N Buckeye Dr