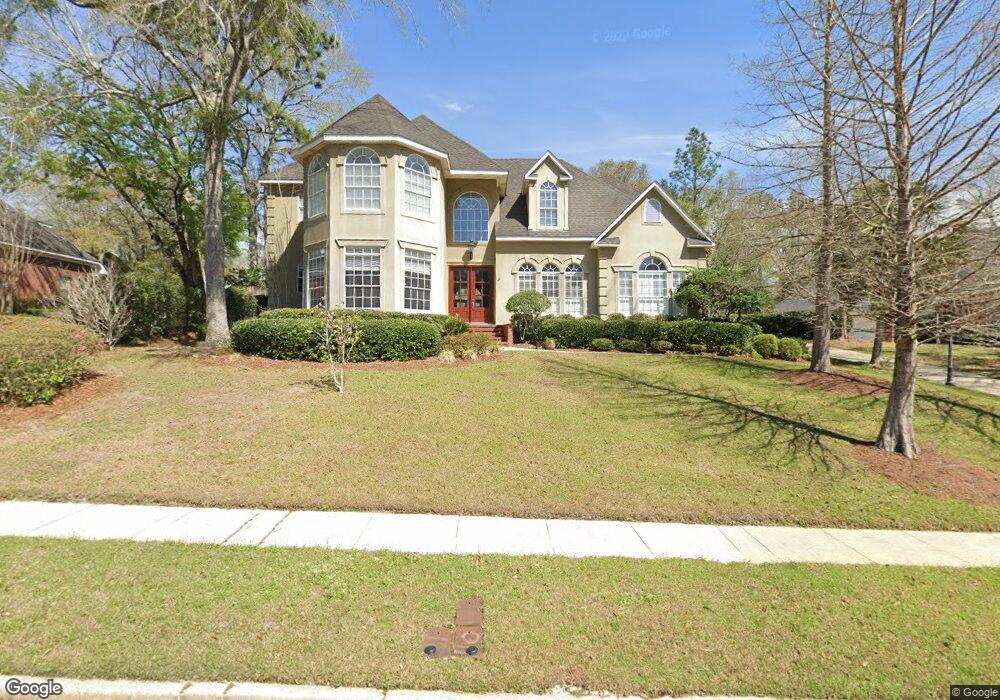
6806 Stonebrook Dr S Mobile, AL 36695
Overton NeighborhoodEstimated Value: $521,000 - $555,579
4
Beds
4
Baths
3,729
Sq Ft
$145/Sq Ft
Est. Value
About This Home
This home is located at 6806 Stonebrook Dr S, Mobile, AL 36695 and is currently estimated at $539,645, approximately $144 per square foot. 6806 Stonebrook Dr S is a home located in Mobile County with nearby schools including O'rourke Elementary School, Burns Middle School, and WP Davidson High School.
Ownership History
Date
Name
Owned For
Owner Type
Purchase Details
Closed on
Oct 17, 2024
Sold by
Nguyen Tuong Vy Thi
Bought by
Greer Craig and Greer Debbie
Current Estimated Value
Purchase Details
Closed on
Jan 18, 2022
Sold by
Scott Jackie L and Scott Jacqueline L
Bought by
Nguyen Tuong Vy Thi
Purchase Details
Closed on
Oct 25, 2001
Sold by
Smith James Oliver and Smith Bertha P
Bought by
Scott Jackie F
Purchase Details
Closed on
Dec 22, 1999
Sold by
Colonial Bank
Bought by
Scott Ronald P and Scott Jackie L
Home Financials for this Owner
Home Financials are based on the most recent Mortgage that was taken out on this home.
Original Mortgage
$226,000
Interest Rate
7.67%
Purchase Details
Closed on
Nov 11, 1999
Sold by
Erol Wallace and Erol Teresa
Bought by
Colonial Bank
Home Financials for this Owner
Home Financials are based on the most recent Mortgage that was taken out on this home.
Original Mortgage
$226,000
Interest Rate
7.67%
Create a Home Valuation Report for This Property
The Home Valuation Report is an in-depth analysis detailing your home's value as well as a comparison with similar homes in the area
Home Values in the Area
Average Home Value in this Area
Purchase History
| Date | Buyer | Sale Price | Title Company |
|---|---|---|---|
| Greer Craig | $540,000 | Delta South Title Inc | |
| Nguyen Tuong Vy Thi | $340,000 | None Listed On Document | |
| Scott Ronald P | $197,200 | None Listed On Document | |
| Scott Jackie F | -- | -- | |
| Scott Ronald P | -- | -- | |
| Colonial Bank | $242,000 | -- |
Source: Public Records
Mortgage History
| Date | Status | Borrower | Loan Amount |
|---|---|---|---|
| Previous Owner | Scott Ronald P | $226,000 |
Source: Public Records
Tax History
| Year | Tax Paid | Tax Assessment Tax Assessment Total Assessment is a certain percentage of the fair market value that is determined by local assessors to be the total taxable value of land and additions on the property. | Land | Improvement |
|---|---|---|---|---|
| 2025 | $2,807 | $44,040 | $7,500 | $36,540 |
| 2024 | $2,807 | $84,460 | $15,000 | $69,460 |
| 2023 | $2,692 | $82,180 | $13,000 | $69,180 |
| 2022 | $2,164 | $38,660 | $6,500 | $32,160 |
| 2021 | $2,208 | $39,440 | $6,500 | $32,940 |
| 2020 | $2,231 | $39,850 | $6,500 | $33,350 |
| 2019 | $2,169 | $38,770 | $6,500 | $32,270 |
| 2018 | $2,192 | $39,180 | $0 | $0 |
| 2017 | $2,318 | $41,380 | $0 | $0 |
| 2016 | $2,628 | $46,820 | $0 | $0 |
| 2013 | $2,629 | $40,400 | $0 | $0 |
Source: Public Records
Map
Nearby Homes
- 2025 Bradbury Dr E
- 2137 Woodlea Dr W
- 7005 Sandy Creek Rd
- 1990 Bradbury Dr E
- 7174 Ashton Ct
- 7238 Belle Chase Dr
- 1930 Bradshire Dr
- 1920 Bradshire Dr
- 7190 Bradshaw Ct
- 7048 Anclote Ct
- 7180 Charlanda Blvd
- 6712 Rolling Green Dr
- 6595 Lubarrett Way Unit 94
- 6591 Lubarrett Way S
- 1735 Ashmoor Dr W
- 1630 Pine Station Rd E
- 6770 Deanna Ct
- 1630 Ashmoor Dr E
- 6448 Canebrake Rd Unit 11
- 6448 Canebrake Rd
- 6810 Stonebrook Dr S Unit 2
- 2004 Stonebrook Dr E
- 6807 Stonebrook Dr S
- 6803 Stonebrook Dr S
- 6805 Stonebrook Dr N
- 2005 Stonebrook Ct
- 2000 Stonebrook Dr E
- 6814 Stonebrook Dr S
- 6811 Stonebrook Dr S
- 2009 Stonebrook Ct
- 6809 Stonebrook Dr N
- 2009 Stonebrook Dr E
- 6815 Stonebrook Dr S
- 6818 Stonebrook Dr S
- 6800 Stonebrook Dr N
- 2005 Stonebrook Dr E
- 6721 Stonebrook Dr N
- 6804 Stonebrook Dr N
- 2008 Stonebrook Ct
- 6819 Stonebrook Dr S
Your Personal Tour Guide
Ask me questions while you tour the home.