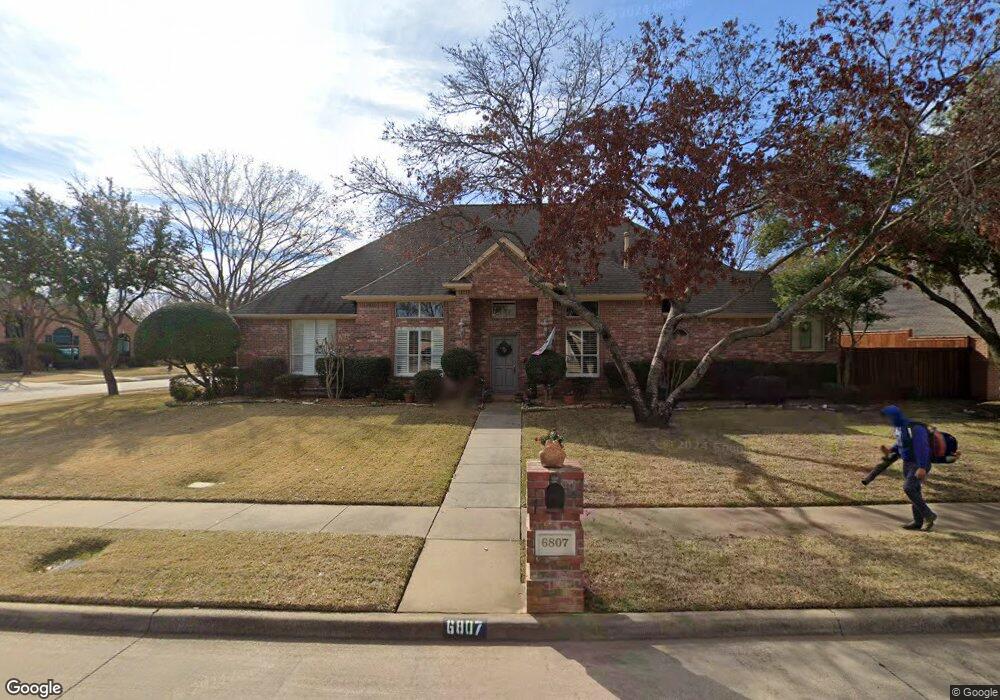
6807 Kennedy Dr Colleyville, TX 76034
Estimated Value: $825,000 - $871,804
4
Beds
3
Baths
3,092
Sq Ft
$274/Sq Ft
Est. Value
About This Home
This home is located at 6807 Kennedy Dr, Colleyville, TX 76034 and is currently estimated at $846,451, approximately $273 per square foot. 6807 Kennedy Dr is a home located in Tarrant County with nearby schools including Glenhope Elementary School, Cross Timbers Middle School, and Grapevine High School.
Ownership History
Date
Name
Owned For
Owner Type
Purchase Details
Closed on
Jul 30, 1997
Sold by
Moore Paul L and Moore Charlotte
Bought by
Lippert Joseph C and Lippert Michele M
Current Estimated Value
Home Financials for this Owner
Home Financials are based on the most recent Mortgage that was taken out on this home.
Original Mortgage
$173,625
Outstanding Balance
$26,162
Interest Rate
7.6%
Estimated Equity
$820,289
Purchase Details
Closed on
Feb 1, 1995
Sold by
Cresent Builder Inc
Bought by
Moore Paul L and Moore Charlotte
Home Financials for this Owner
Home Financials are based on the most recent Mortgage that was taken out on this home.
Original Mortgage
$140,000
Interest Rate
9.13%
Purchase Details
Closed on
Oct 3, 1994
Sold by
E R O Development Co Inc
Bought by
Crescent Builders Inc and Casa Linda Builders
Home Financials for this Owner
Home Financials are based on the most recent Mortgage that was taken out on this home.
Original Mortgage
$168,000
Interest Rate
8.5%
Create a Home Valuation Report for This Property
The Home Valuation Report is an in-depth analysis detailing your home's value as well as a comparison with similar homes in the area
Home Values in the Area
Average Home Value in this Area
Purchase History
| Date | Buyer | Sale Price | Title Company |
|---|---|---|---|
| Lippert Joseph C | -- | Rattikin Title Co | |
| Moore Paul L | -- | Trinity Western Title Co | |
| Crescent Builders Inc | -- | Trinity Western Title Co |
Source: Public Records
Mortgage History
| Date | Status | Borrower | Loan Amount |
|---|---|---|---|
| Open | Lippert Joseph C | $173,625 | |
| Previous Owner | Moore Paul L | $140,000 | |
| Previous Owner | Crescent Builders Inc | $168,000 | |
| Closed | Lippert Joseph C | $34,725 |
Source: Public Records
Tax History Compared to Growth
Tax History
| Year | Tax Paid | Tax Assessment Tax Assessment Total Assessment is a certain percentage of the fair market value that is determined by local assessors to be the total taxable value of land and additions on the property. | Land | Improvement |
|---|---|---|---|---|
| 2025 | $1,940 | $704,167 | $167,050 | $537,117 |
| 2024 | $1,940 | $778,094 | $167,050 | $611,044 |
| 2023 | $10,152 | $712,158 | $167,050 | $545,108 |
| 2022 | $10,806 | $627,626 | $167,050 | $460,576 |
| 2021 | $10,923 | $497,394 | $110,000 | $387,394 |
| 2020 | $11,202 | $504,120 | $110,000 | $394,120 |
| 2019 | $11,697 | $505,934 | $110,000 | $395,934 |
| 2018 | $2,013 | $472,771 | $110,000 | $362,771 |
| 2017 | $10,154 | $467,924 | $95,000 | $372,924 |
| 2016 | $9,231 | $430,516 | $95,000 | $335,516 |
| 2015 | $6,009 | $355,200 | $40,000 | $315,200 |
| 2014 | $6,009 | $355,200 | $40,000 | $315,200 |
Source: Public Records
Map
Nearby Homes
- 7001 Colleyville Blvd
- 2406 Wilkes Dr
- 2008 Kyle Ct
- 7208 Stilton Ct
- 2602 Pointe Ct
- 2618 Pointe Ct
- 3589 Boxwood Dr
- 7322 Calloway Ct
- 7316 Calloway Ct
- 1417 Nottoway Ct
- 1418 Nottoway Ct
- 1406 Nottoway Ct
- 7106 Belle Meade Dr
- 3052 Ridgeview Dr
- 7200 Belle Meade Dr
- 1509 Tinker Rd
- 1719 Byron Nelson Pkwy
- 3032 Ridgebend Dr
- 524 Queensbury Turn
- 1813 Grosvenor Green
- 6805 Kennedy Dr
- 6710 Carriage Ln
- 6801 Carriage Ln
- 6814 Kennedy Dr
- 6803 Carriage Ln
- 6812 Kennedy Dr
- 6803 Kennedy Dr
- 6711 Carriage Ln
- 6708 Carriage Ln
- 6805 Carriage Ln
- 6808 Kennedy Dr
- 6709 Carriage Ln
- 6801 Kennedy Dr
- 6806 Kennedy Dr
- 6802 Meade Dr
- 6804 Meade Dr
- 6800 Meade Dr
- 6706 Carriage Ln
- 6707 Carriage Ln
- 6710 Meade Dr