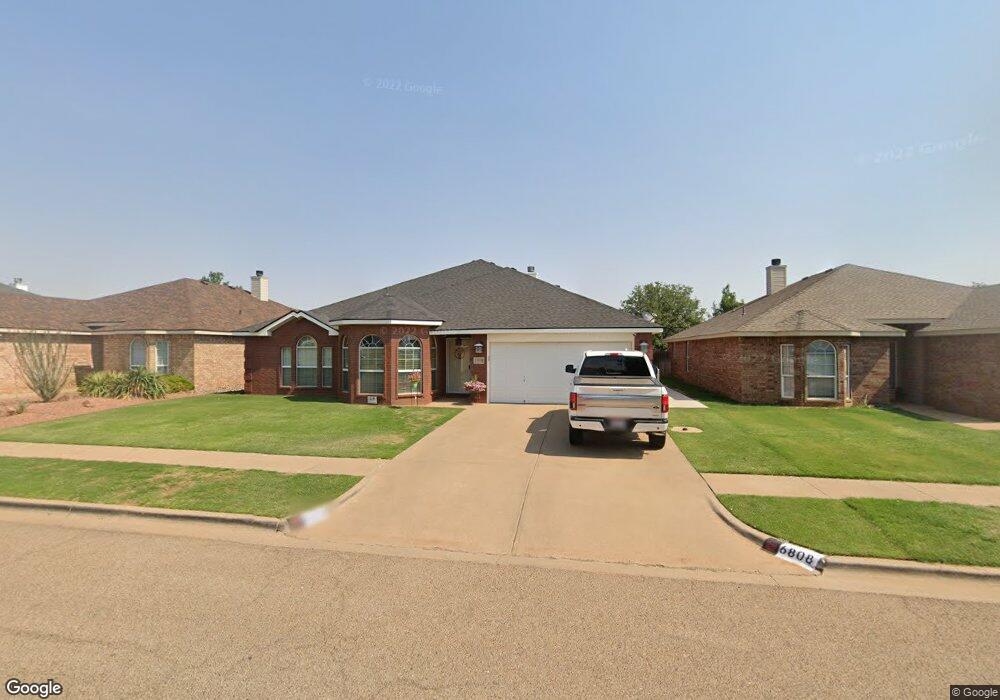
6808 86th St Lubbock, TX 79424
Estimated Value: $243,000 - $248,597
3
Beds
2
Baths
2,060
Sq Ft
$119/Sq Ft
Est. Value
About This Home
This home is located at 6808 86th St, Lubbock, TX 79424 and is currently estimated at $245,899, approximately $119 per square foot. 6808 86th St is a home located in Lubbock County with nearby schools including Oak Ridge Elementary School, Heritage Middle School, and Frenship High School.
Ownership History
Date
Name
Owned For
Owner Type
Purchase Details
Closed on
Feb 8, 2013
Sold by
Davidson Lyndsey L and Davidson Austin H
Bought by
Jmrp Llc
Current Estimated Value
Purchase Details
Closed on
Oct 1, 2009
Sold by
Sanders Marissa Anne Allshouse
Bought by
Sanders Ryan and Sanders Ryan Shayne
Purchase Details
Closed on
Jul 2, 2003
Sold by
Monterey I Ltd
Bought by
Turnbow Kevin T and Tricia Jo
Purchase Details
Closed on
Apr 25, 2003
Sold by
Quality Land Devlpmnt Ltd
Bought by
Turnbow Kevin T and Tricia Jo
Create a Home Valuation Report for This Property
The Home Valuation Report is an in-depth analysis detailing your home's value as well as a comparison with similar homes in the area
Home Values in the Area
Average Home Value in this Area
Purchase History
| Date | Buyer | Sale Price | Title Company |
|---|---|---|---|
| Jmrp Llc | -- | Service Title Company | |
| Sanders Ryan | -- | Western Title Company | |
| Turnbow Kevin T | -- | -- | |
| Turnbow Kevin T | -- | -- |
Source: Public Records
Tax History Compared to Growth
Tax History
| Year | Tax Paid | Tax Assessment Tax Assessment Total Assessment is a certain percentage of the fair market value that is determined by local assessors to be the total taxable value of land and additions on the property. | Land | Improvement |
|---|---|---|---|---|
| 2025 | $3,836 | $241,837 | $8,000 | $233,837 |
| 2024 | $3,836 | $241,837 | $8,000 | $233,837 |
| 2023 | $4,973 | $237,502 | $8,000 | $229,502 |
| 2022 | $4,916 | $215,911 | $8,000 | $218,568 |
| 2021 | $4,747 | $196,283 | $8,000 | $188,283 |
| 2020 | $4,421 | $181,982 | $8,000 | $173,982 |
| 2019 | $4,462 | $178,465 | $8,000 | $170,465 |
| 2018 | $4,411 | $176,229 | $8,000 | $168,229 |
| 2017 | $4,250 | $169,605 | $8,000 | $161,605 |
| 2016 | $4,151 | $165,675 | $8,000 | $157,675 |
| 2015 | $3,638 | $154,622 | $8,000 | $146,622 |
| 2014 | $3,638 | $145,033 | $8,000 | $137,033 |
Source: Public Records
Map
Nearby Homes