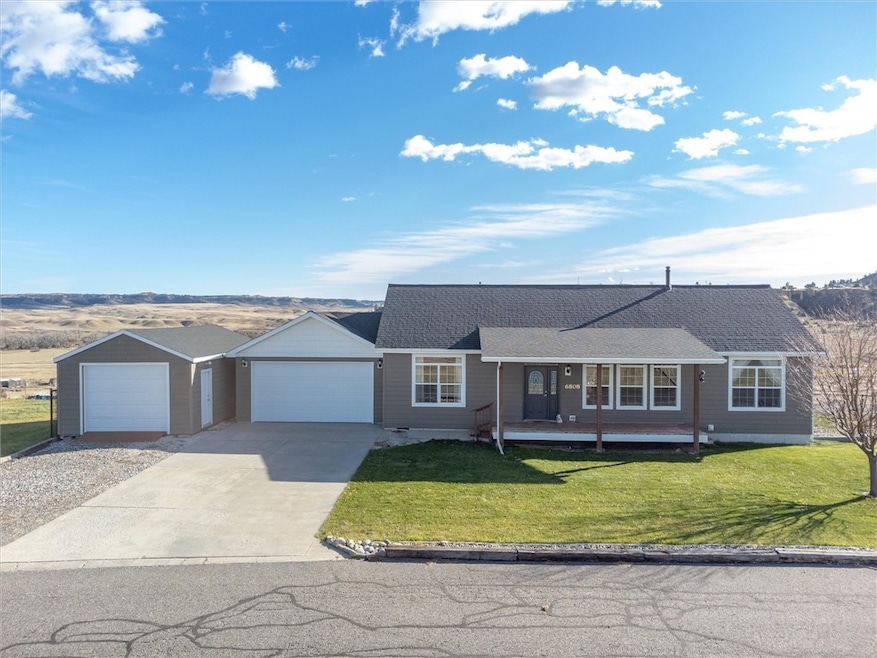
6808 Earl Ave Huntley, MT 59037
Estimated payment $2,165/month
Highlights
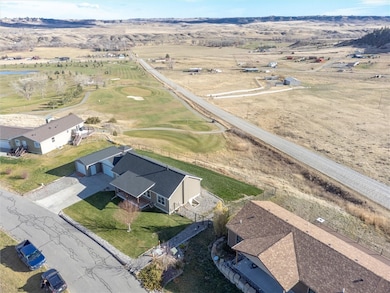
- On Golf Course
- 1 Fireplace
- 3 Car Attached Garage
- Deck
- Front Porch
- Cooling Available
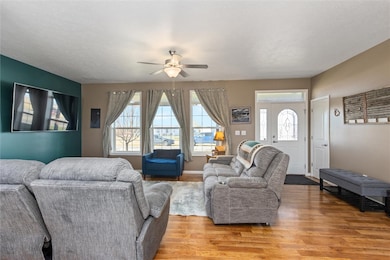
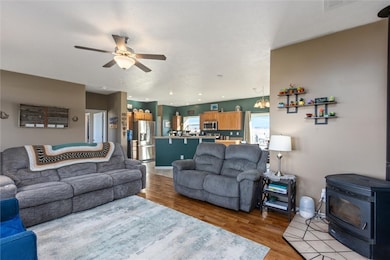
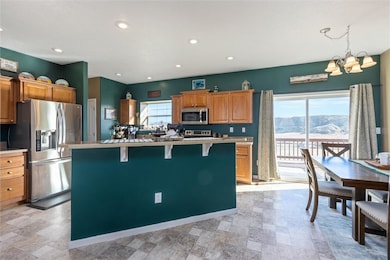
About This Home
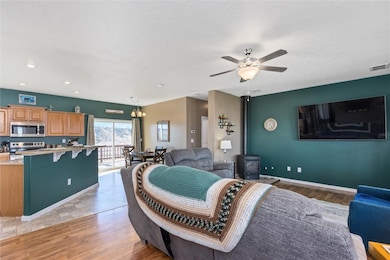
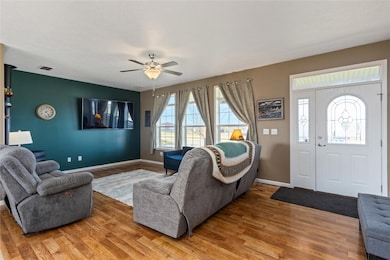
Discover this beautiful single-level home perfectly situated on the 6th hole of the prestigious Pryor Creek Golf Course. Enjoy an open-concept living area filled with natural light, complete with a cozy pellet stove for those cooler evenings. This home offers three bedrooms and two bathrooms, along with a spacious back deck featuring stunning, unobstructed golf course views. A two-car garage and a small detached shop provide ample space for lawn equipment, a golf cart, or hobbies. Added perks include newer appliances, a new roof, gutters, insulated garage door (2025) and chain-link fence. (2024) As a bonus, the purchase includes one membership to the highly sought-after Pryor Creek Golf Course (dues not included). Electric forced air and AC along with community well and septic. Schedule your private tour today and experience golf course living at its finest!
Listing Agent
Meridian Real Estate LLC Brokerage Phone: (406) 690-0800 Listed on: 11/13/2025
Open House Schedule
-
Sunday, November 16, 202512:00 to 2:00 pm11/16/2025 12:00:00 PM +00:0011/16/2025 2:00:00 PM +00:00Add to Calendar
Property Details
Home Type
- Modular Prefabricated Home
Est. Annual Taxes
- $1,336
Year Built
- Built in 2009
Lot Details
- 0.3 Acre Lot
- On Golf Course
- Fenced
- Sprinkler System
HOA Fees
- $25 Monthly HOA Fees
Parking
- 3 Car Attached Garage
- Workshop in Garage
- Garage Door Opener
Home Design
- Single Family Detached Home
- Modular Prefabricated Home
- Shingle Roof
- Asphalt Roof
- HardiePlank Type
Interior Spaces
- 1,456 Sq Ft Home
- 1-Story Property
- 1 Fireplace
- Crawl Space
- Property Views
Kitchen
- Oven
- Electric Range
- Microwave
- Dishwasher
Bedrooms and Bathrooms
- 3 Main Level Bedrooms
- 2 Full Bathrooms
Outdoor Features
- Deck
- Front Porch
Schools
- Huntley Project Elementary And Middle School
- Huntley Project High School
Utilities
- Cooling Available
- Forced Air Heating System
- Co-Op Water
- Shared Well
- Well
- Septic Tank
Listing and Financial Details
- Assessor Parcel Number C16342
Community Details
Overview
- Pryor Hills Subdivision
Building Details
- Electric Expense $165
Map
Home Values in the Area
Average Home Value in this Area
Tax History
| Year | Tax Paid | Tax Assessment Tax Assessment Total Assessment is a certain percentage of the fair market value that is determined by local assessors to be the total taxable value of land and additions on the property. | Land | Improvement |
|---|---|---|---|---|
| 2025 | $1,819 | $359,700 | $51,978 | $307,722 |
| 2024 | $1,819 | $304,000 | $54,192 | $249,808 |
| 2023 | $2,218 | $304,000 | $54,192 | $249,808 |
| 2022 | $1,920 | $253,600 | $0 | $0 |
| 2021 | $1,997 | $253,600 | $0 | $0 |
| 2020 | $1,948 | $243,500 | $0 | $0 |
| 2019 | $1,896 | $243,500 | $0 | $0 |
| 2018 | $1,916 | $230,900 | $0 | $0 |
| 2017 | $1,589 | $223,500 | $0 | $0 |
| 2016 | $1,457 | $204,800 | $0 | $0 |
| 2015 | $1,576 | $204,800 | $0 | $0 |
| 2014 | $1,386 | $95,665 | $0 | $0 |
Property History
| Date | Event | Price | List to Sale | Price per Sq Ft |
|---|---|---|---|---|
| 11/13/2025 11/13/25 | For Sale | $385,000 | -- | $264 / Sq Ft |
Purchase History
| Date | Type | Sale Price | Title Company |
|---|---|---|---|
| Warranty Deed | -- | None Listed On Document | |
| Warranty Deed | -- | Chicago Title | |
| Quit Claim Deed | -- | None Available | |
| Warranty Deed | -- | None Available |
Mortgage History
| Date | Status | Loan Amount | Loan Type |
|---|---|---|---|
| Open | $282,727 | New Conventional | |
| Previous Owner | $208,905 | New Conventional |
Source: Billings Multiple Listing Service
MLS Number: 356537
APN: 03-1034-01-2-41-07-0000
Disclaimer: Certain information contained herein is derived from information provided by parties other than Homes.com. All information provided is deemed reliable, but is not guaranteed to be accurate and should be independently verified.
![]() IDX information is provided exclusively for personal, non-commercial use, and may not be used for any purpose other than to identify prospective properties consumers may be interested in purchasing. Information is deemed reliable but not guaranteed.
IDX information is provided exclusively for personal, non-commercial use, and may not be used for any purpose other than to identify prospective properties consumers may be interested in purchasing. Information is deemed reliable but not guaranteed.
- 6815 Yellowstone Trail
- 1191 Chipper Ln
- 3631 Lynette Ln
- 1246 Chipper Ln
- 1251 Chipper Ln
- 0000 Florian Ave
- 5400 Blue Horizon Dr
- 109 Peritse Ave
- 119 Peritse Ave
- 581 Squaw Creek Rd
- 0 Great Northern Unit 354449
- 4820 McGirl Rd
- 5840,5850,5904 Lunder Ln
- 5040 Old Hardin Rd
- 4511 Pine Hills Rd
- 5510 Powmer Rd
- 6447 US Highway 312
- 5042 Old Hardin Rd
- 5197 Montana City
- 4828 Eco Built Way
- 3831 Plains Dr
- 29 Hartland St N
- 7 Rainier St N
- 16 Rainier St N
- 10 Vandalay St
- 22 Tartarian St
- 6 Lapin St
- 927 Bench Blvd
- 933 Bench Blvd
- 1526 Lake Elmo Dr
- 1526 Lake Elmo Dr
- 1512 Lake Elmo Dr
- 1512 Lake Elmo Dr
- 850 Lake Elmo Dr
- 1327 Hardrock Ln Unit 1327 hardrock 1
- 191 Bohl Ave
- 1937 Clubhouse Way
- 2058 Clubhouse Way Unit 1
- 1551 Nottingham Place
- 338 Moccasin Trail Unit 344
