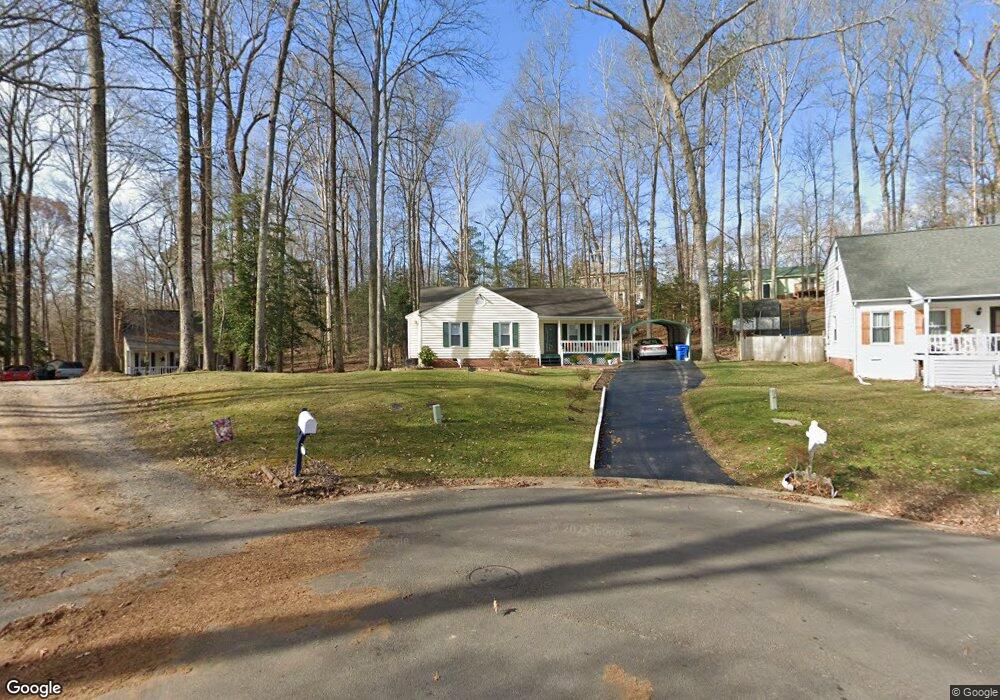
6808 Full Rack Cir Midlothian, VA 23112
Estimated Value: $315,000 - $334,000
3
Beds
3
Baths
1,326
Sq Ft
$245/Sq Ft
Est. Value
About This Home
This home is located at 6808 Full Rack Cir, Midlothian, VA 23112 and is currently estimated at $325,118, approximately $245 per square foot. 6808 Full Rack Cir is a home located in Chesterfield County with nearby schools including Alberta Smith Elementary School, Bailey Bridge Middle School, and Manchester High.
Ownership History
Date
Name
Owned For
Owner Type
Purchase Details
Closed on
Aug 9, 2011
Sold by
Paul Exr Vellie M
Bought by
Amodeo Mary L
Current Estimated Value
Home Financials for this Owner
Home Financials are based on the most recent Mortgage that was taken out on this home.
Original Mortgage
$144,735
Outstanding Balance
$104,438
Interest Rate
5.5%
Mortgage Type
FHA
Estimated Equity
$220,680
Purchase Details
Closed on
May 17, 1999
Sold by
Marable Doris A
Bought by
Tinsley Alice R
Home Financials for this Owner
Home Financials are based on the most recent Mortgage that was taken out on this home.
Original Mortgage
$70,500
Interest Rate
6.92%
Mortgage Type
New Conventional
Purchase Details
Closed on
Aug 5, 1996
Sold by
Rosenberg Michael D
Bought by
Marable Doris A
Home Financials for this Owner
Home Financials are based on the most recent Mortgage that was taken out on this home.
Original Mortgage
$35,000
Interest Rate
8.27%
Mortgage Type
New Conventional
Create a Home Valuation Report for This Property
The Home Valuation Report is an in-depth analysis detailing your home's value as well as a comparison with similar homes in the area
Home Values in the Area
Average Home Value in this Area
Purchase History
| Date | Buyer | Sale Price | Title Company |
|---|---|---|---|
| Amodeo Mary L | $153,800 | -- | |
| Tinsley Alice R | $94,000 | -- | |
| Marable Doris A | $84,500 | -- |
Source: Public Records
Mortgage History
| Date | Status | Borrower | Loan Amount |
|---|---|---|---|
| Open | Amodeo Mary L | $144,735 | |
| Previous Owner | Marable Doris A | $70,500 | |
| Previous Owner | Marable Doris A | $35,000 |
Source: Public Records
Tax History Compared to Growth
Tax History
| Year | Tax Paid | Tax Assessment Tax Assessment Total Assessment is a certain percentage of the fair market value that is determined by local assessors to be the total taxable value of land and additions on the property. | Land | Improvement |
|---|---|---|---|---|
| 2025 | $25 | $273,700 | $62,000 | $211,700 |
| 2024 | $25 | $263,700 | $60,000 | $203,700 |
| 2023 | $2,251 | $247,400 | $57,000 | $190,400 |
| 2022 | $2,090 | $227,200 | $54,000 | $173,200 |
| 2021 | $1,942 | $197,500 | $52,000 | $145,500 |
| 2020 | $1,780 | $187,400 | $50,000 | $137,400 |
| 2019 | $1,714 | $180,400 | $48,000 | $132,400 |
| 2018 | $1,645 | $173,200 | $47,000 | $126,200 |
| 2017 | $1,535 | $159,900 | $44,000 | $115,900 |
| 2016 | $1,462 | $152,300 | $43,000 | $109,300 |
| 2015 | $1,459 | $149,400 | $42,000 | $107,400 |
| 2014 | $920 | $147,400 | $41,000 | $106,400 |
Source: Public Records
Map
Nearby Homes
- 13501 Buck Rub Dr
- 7136 Velvet Antler Dr
- 13305 Pointer Ridge Terrace
- 13707 Swale Ln
- 13628 Baycraft Terrace
- 7018 Spring Trace Terrace
- 7112 Deer Thicket Dr
- 31 Spinnaker Cove Dr
- 6001 Harbourwood Ct
- 7706 Northern Dancer Ct
- 13813 Kentucky Derby Place
- 7806 Belmont Stakes Dr
- 13905 N Point Rd
- 5601 Promontory Pointe Rd
- 4902 Court Ridge Terrace
- 13812 Rockport Landing Rd
- 13300 Court Ridge Rd
- 14319 Key Deer Dr
- 4714 Five Springs Ct
- 14206 Triple Crown Dr
- 6806 Full Rack Cir
- 6810 Full Rack Cir
- 6807 Sika Ct
- 6811 Full Rack Cir
- 6805 Sika Ct
- 6809 Sika Ct
- 6804 Full Rack Cir
- 6803 Sika Ct
- 6809 Full Rack Cir
- 6807 Full Rack Cir
- 6811 Sika Ct
- 6802 Full Rack Cir
- 6901 Full Rack Place
- 6900 Full Rack Ct
- 6803 Full Rack Cir
- 6900 Full Rack Place
- 6901 Full Rack Ct
- 6801 Sika Ct
- 6808 Sika Ct
- 6806 Sika Ct