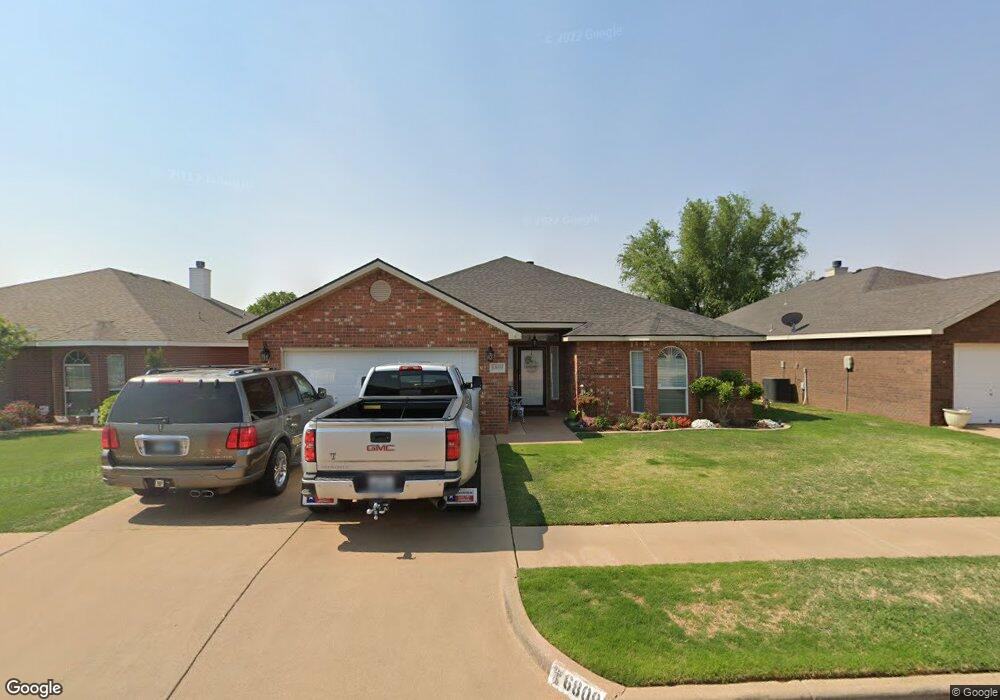
6809 86th St Lubbock, TX 79424
South West Lubbock NeighborhoodEstimated Value: $253,999 - $270,000
4
Beds
2
Baths
2,249
Sq Ft
$115/Sq Ft
Est. Value
About This Home
This home is located at 6809 86th St, Lubbock, TX 79424 and is currently estimated at $258,750, approximately $115 per square foot. 6809 86th St is a home located in Lubbock County with nearby schools including Oak Ridge Elementary School, Heritage Middle School, and Frenship High School.
Ownership History
Date
Name
Owned For
Owner Type
Purchase Details
Closed on
Aug 28, 2007
Sold by
Shin Jong Shik and Jung Soon
Bought by
Gutierrez Elida and Gutierrez Manuel
Current Estimated Value
Home Financials for this Owner
Home Financials are based on the most recent Mortgage that was taken out on this home.
Original Mortgage
$140,200
Outstanding Balance
$89,039
Interest Rate
6.72%
Mortgage Type
Purchase Money Mortgage
Estimated Equity
$169,711
Purchase Details
Closed on
Aug 17, 2005
Sold by
Yen Soon Kim
Bought by
Gutierrez Elida and Gutierrez Manuel
Purchase Details
Closed on
Dec 16, 2003
Sold by
Monterey I Ltd
Bought by
Gutierrez Elida and Gutierrez Manuel
Create a Home Valuation Report for This Property
The Home Valuation Report is an in-depth analysis detailing your home's value as well as a comparison with similar homes in the area
Home Values in the Area
Average Home Value in this Area
Purchase History
| Date | Buyer | Sale Price | Title Company |
|---|---|---|---|
| Gutierrez Elida | -- | Stewart Title | |
| Gutierrez Elida | -- | -- | |
| Gutierrez Elida | -- | -- |
Source: Public Records
Mortgage History
| Date | Status | Borrower | Loan Amount |
|---|---|---|---|
| Open | Gutierrez Elida | $140,200 |
Source: Public Records
Tax History
| Year | Tax Paid | Tax Assessment Tax Assessment Total Assessment is a certain percentage of the fair market value that is determined by local assessors to be the total taxable value of land and additions on the property. | Land | Improvement |
|---|---|---|---|---|
| 2025 | $2,106 | $241,836 | $8,000 | $233,836 |
| 2024 | $49 | $239,134 | $8,000 | $231,134 |
| 2023 | $2,106 | $227,605 | $8,000 | $238,526 |
| 2022 | $4,711 | $206,914 | $8,000 | $208,977 |
| 2021 | $4,549 | $188,104 | $8,000 | $180,104 |
| 2020 | $4,339 | $178,610 | $8,000 | $170,610 |
| 2019 | $4,380 | $175,184 | $8,000 | $167,184 |
| 2018 | $4,379 | $174,956 | $8,000 | $166,956 |
| 2017 | $4,219 | $168,381 | $8,000 | $160,381 |
| 2016 | $4,122 | $164,482 | $8,000 | $156,482 |
| 2015 | $3,359 | $152,423 | $8,000 | $144,423 |
| 2014 | $3,359 | $142,979 | $8,000 | $134,979 |
Source: Public Records
Map
Nearby Homes
Your Personal Tour Guide
Ask me questions while you tour the home.