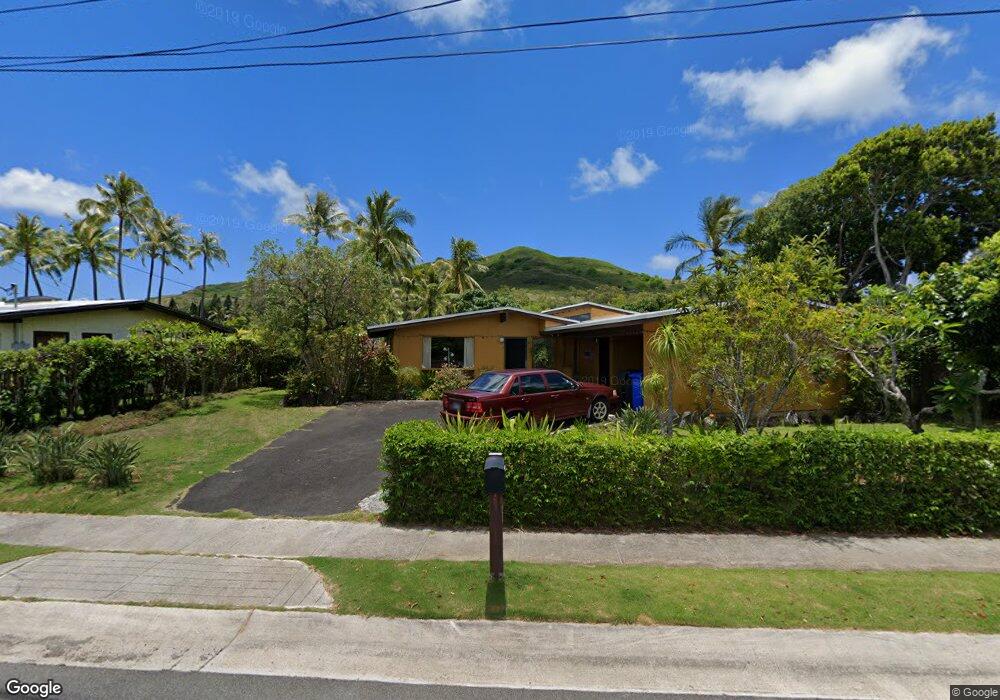
681 Paopua Loop Kailua, HI 96734
Estimated Value: $1,540,000 - $1,758,000
3
Beds
2
Baths
988
Sq Ft
$1,665/Sq Ft
Est. Value
About This Home
This home is located at 681 Paopua Loop, Kailua, HI 96734 and is currently estimated at $1,645,347, approximately $1,665 per square foot. 681 Paopua Loop is a home located in Honolulu County with nearby schools including Enchanted Lake Elementary School, Kailua Intermediate School, and Kailua High School.
Ownership History
Date
Name
Owned For
Owner Type
Purchase Details
Closed on
May 16, 2022
Sold by
Carson W Axtell Trust
Bought by
Linda M Axtell-Thompson Trust
Current Estimated Value
Purchase Details
Closed on
Apr 13, 2011
Sold by
Axtell Benjamin Laurence
Bought by
Axtell Benjamin L and Benjamin L Axtell Trust
Purchase Details
Closed on
Dec 27, 2010
Sold by
Axtell Carson Willard
Bought by
Axtell Carson W and Carson W Axtell Trust
Purchase Details
Closed on
Oct 8, 2010
Sold by
Axtell Thompson Linda Mitsui
Bought by
Axtell Thompson Linda M and Linda M Axtell Thompson Trust
Purchase Details
Closed on
Sep 29, 2010
Sold by
Axtell Laurence Willard and Axtell Fujiko Iwashita
Bought by
Axtell Carson Willard and Axtell Thompson Linda Mitsui
Purchase Details
Closed on
Apr 25, 1997
Sold by
Axtell Laurence Willard and Axtell Fujiko Iwashita
Bought by
Axtell Laurence Willard and Axtell Fujiko Iwashita
Create a Home Valuation Report for This Property
The Home Valuation Report is an in-depth analysis detailing your home's value as well as a comparison with similar homes in the area
Home Values in the Area
Average Home Value in this Area
Purchase History
| Date | Buyer | Sale Price | Title Company |
|---|---|---|---|
| Linda M Axtell-Thompson Trust | -- | First American Title Of Hawaii | |
| Linda M Axtell-Thompson Trust | -- | First American Title Of Hawaii | |
| Axtell Benjamin L | -- | None Available | |
| Axtell Carson W | -- | None Available | |
| Axtell Thompson Linda M | -- | None Available | |
| Axtell Carson Willard | -- | None Available | |
| Axtell Laurence Willard | -- | None Available | |
| Axtell Laurence Willard | -- | -- |
Source: Public Records
Tax History Compared to Growth
Tax History
| Year | Tax Paid | Tax Assessment Tax Assessment Total Assessment is a certain percentage of the fair market value that is determined by local assessors to be the total taxable value of land and additions on the property. | Land | Improvement |
|---|---|---|---|---|
| 2025 | $13,153 | $1,782,200 | $1,630,000 | $152,200 |
| 2024 | $13,153 | $1,802,900 | $1,630,000 | $172,900 |
| 2023 | $11,206 | $1,632,100 | $1,630,000 | $2,100 |
| 2022 | $10,034 | $1,527,000 | $1,450,000 | $77,000 |
| 2021 | $3,778 | $1,219,300 | $1,070,000 | $149,300 |
| 2020 | $3,358 | $1,099,400 | $1,070,000 | $29,400 |
| 2019 | $3,421 | $1,117,600 | $1,050,000 | $67,600 |
| 2018 | $3,421 | $1,097,400 | $1,000,000 | $97,400 |
| 2017 | $3,161 | $1,023,200 | $910,000 | $113,200 |
| 2016 | $2,948 | $962,300 | $850,000 | $112,300 |
| 2015 | $2,828 | $928,000 | $800,000 | $128,000 |
| 2014 | $2,286 | $890,100 | $740,000 | $150,100 |
Source: Public Records
Map
Nearby Homes
- 757 Akumu St
- 976 Kalawai Place Unit 4B
- 519 Wanaao Rd
- 889 Akumu St
- 411 Kaelepulu Dr Unit E
- 389 Kaelepulu Dr Unit 1501
- 279 Kakahiaka St
- 1338 Kuuna Place
- 391 Kaelepulu Dr Unit A
- 358 Kaelepulu Dr Unit 702
- 358D Kaelepulu Dr Unit 704
- 1164 Manulani St
- 1410 Kahili St Unit A
- 1227 Mowai St
- 348H Kaelepulu Dr Unit 608
- 350 Kaelepulu Dr Unit 401
- 599 Keolu Dr Unit B
- 1233 Keolu Dr
- 1214 Kina St
- 1015 Aoloa Place Unit 437