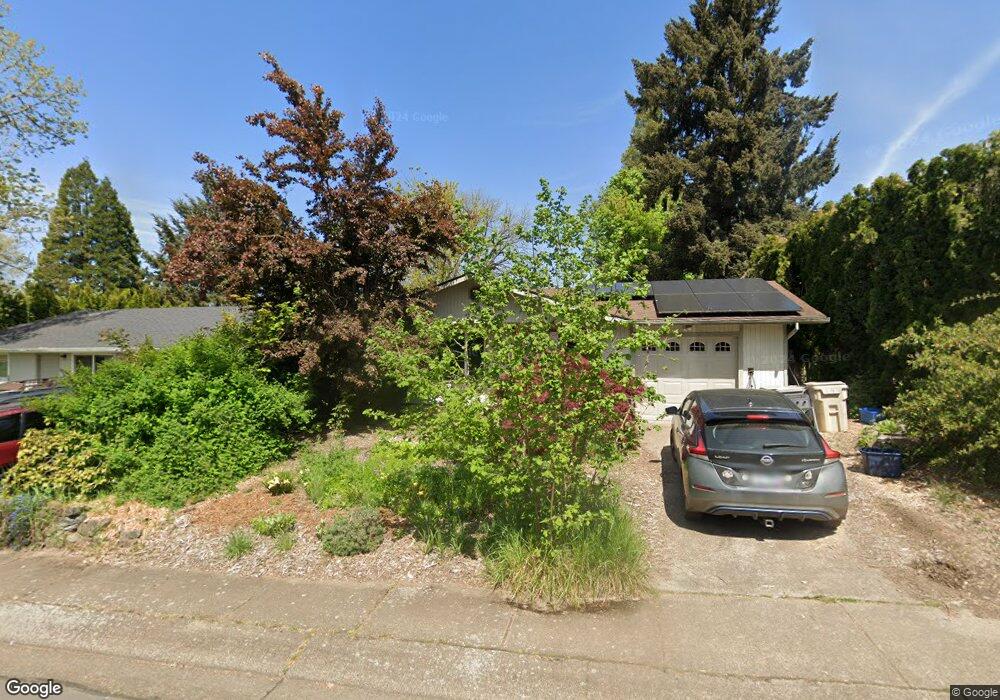
681 SE Mayberry Ave Corvallis, OR 97333
South Corvallis NeighborhoodEstimated Value: $401,499 - $427,000
3
Beds
1
Bath
1,056
Sq Ft
$387/Sq Ft
Est. Value
About This Home
This home is located at 681 SE Mayberry Ave, Corvallis, OR 97333 and is currently estimated at $408,625, approximately $386 per square foot. 681 SE Mayberry Ave is a home located in Benton County with nearby schools including Lincoln Elementary School, Linus Pauling Middle School, and Corvallis High School.
Ownership History
Date
Name
Owned For
Owner Type
Purchase Details
Closed on
Jun 11, 2024
Sold by
Wilson Reed
Bought by
Wilson Katelin
Current Estimated Value
Purchase Details
Closed on
Nov 13, 2014
Sold by
Wilson Daryl D
Bought by
Wilson Reed M
Purchase Details
Closed on
Apr 7, 2006
Sold by
Cervantes Shannon and Cervantes Noah
Bought by
Wilson Daryl D and Wilson Reed M
Home Financials for this Owner
Home Financials are based on the most recent Mortgage that was taken out on this home.
Original Mortgage
$114,900
Interest Rate
6.25%
Mortgage Type
Fannie Mae Freddie Mac
Purchase Details
Closed on
Oct 18, 2001
Sold by
Chase Manhattan Company
Bought by
Cervantes Arthur and Cervantes Lynn
Purchase Details
Closed on
Feb 8, 2001
Sold by
Ragan Sandra
Bought by
Chase Mtg Company
Purchase Details
Closed on
Oct 13, 1994
Bought by
Wilson Reed M
Create a Home Valuation Report for This Property
The Home Valuation Report is an in-depth analysis detailing your home's value as well as a comparison with similar homes in the area
Home Values in the Area
Average Home Value in this Area
Purchase History
| Date | Buyer | Sale Price | Title Company |
|---|---|---|---|
| Wilson Katelin | -- | None Listed On Document | |
| Wilson Reed M | -- | None Available | |
| Wilson Daryl D | $167,500 | Ticor Title | |
| Cervantes Arthur | -- | Oregon Title Insurance Co | |
| Chase Mtg Company | $79,200 | -- | |
| Wilson Reed M | $96,500 | -- |
Source: Public Records
Mortgage History
| Date | Status | Borrower | Loan Amount |
|---|---|---|---|
| Previous Owner | Wilson Daryl D | $114,900 |
Source: Public Records
Tax History Compared to Growth
Tax History
| Year | Tax Paid | Tax Assessment Tax Assessment Total Assessment is a certain percentage of the fair market value that is determined by local assessors to be the total taxable value of land and additions on the property. | Land | Improvement |
|---|---|---|---|---|
| 2025 | $3,415 | $183,098 | -- | -- |
| 2024 | $3,415 | $177,765 | -- | -- |
| 2023 | $3,215 | $172,587 | $0 | $0 |
| 2022 | $3,121 | $167,560 | $0 | $0 |
| 2021 | $3,018 | $162,680 | $0 | $0 |
| 2020 | $3,002 | $157,942 | $0 | $0 |
| 2019 | $2,767 | $153,342 | $0 | $0 |
| 2018 | $2,781 | $148,876 | $0 | $0 |
| 2017 | $2,573 | $144,540 | $0 | $0 |
| 2016 | $2,528 | $140,330 | $0 | $0 |
| 2015 | $2,450 | $136,243 | $0 | $0 |
| 2014 | $2,373 | $132,275 | $0 | $0 |
| 2012 | -- | $124,682 | $0 | $0 |
Source: Public Records
Map
Nearby Homes
- 350 SE Lilly Ave
- 192 SE Atwood Ave
- 413 SW Butterfield Place
- 388 SW Butterfield Place
- 565 SE Firefly Ave
- 245 SE Jensen Ave
- 235 SE Jensen Ave
- 255 SE Jensen Ave
- 1625-2 Plan at Beverly Gleanns - Townhomes
- 1465-2 Plan at Beverly Gleanns - Townhomes
- 1614-1 Plan at Beverly Gleanns - Detached Homes
- 300 SE Goodnight Ave Unit 21
- 300 SE Goodnight Ave
- 300 SE Goodnight Ave Unit 56
- 300 SE Goodnight Ave Unit 83 Av
- 1250 SW E Ave
- 1003 SW 10th St
- 300 SE Goodnight Av (#31) Ave Unit 31
- 420 SW Wake Robin (-450) Ave
- 944 SW 10th St
- 695 SE Mayberry Ave
- 663 SE Mayberry Ave
- 719 SE Mayberry Ave
- 655 SE Mayberry Ave
- 650 SE Lilly Ave
- 731 SE Mayberry Ave
- 590 SE Lilly Ave
- 767 SE Mayberry Ave
- 580 SE Mayberry Ave
- 670 SE Lilly Ave
- 570 SE Mayberry Ave
- 710 SE Lilly Ave
- 710 SE Lilly Ave Unit B
- 724 SE Mayberry Ave
- 545 SE Mayberry Ave
- 720 SE Lilly Ave
- 620 SE Lilly Ave
- 560 SE Mayberry Ave
- 560 SE Lilly Ave
- 740 SE Lilly Ave