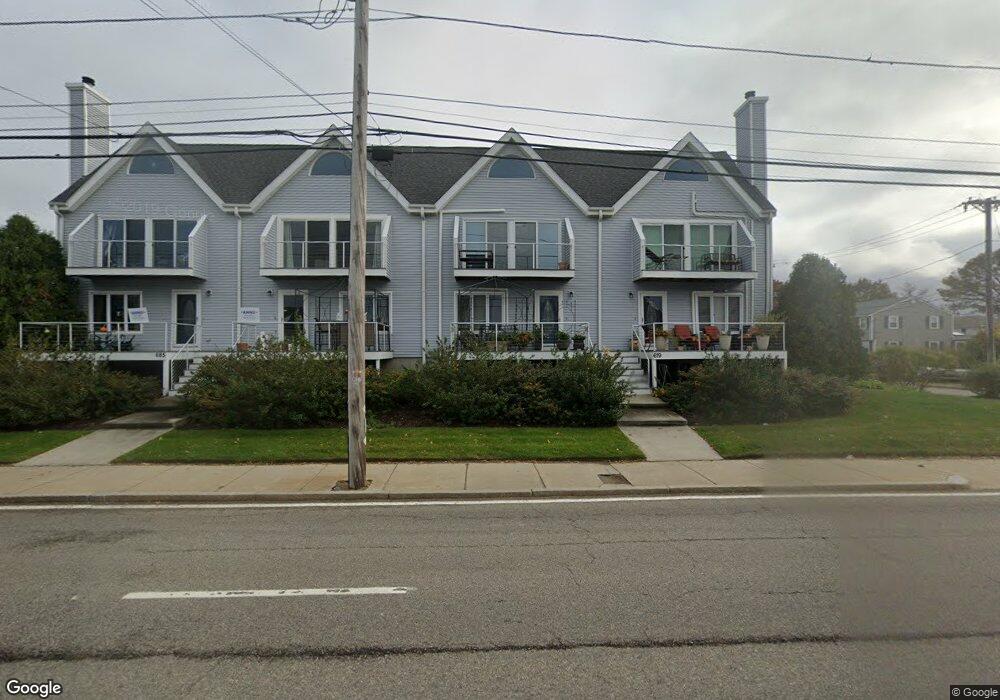
681 Sea St Quincy, MA 02169
Houghs Neck NeighborhoodEstimated Value: $524,082 - $608,000
2
Beds
2
Baths
1,428
Sq Ft
$391/Sq Ft
Est. Value
About This Home
This home is located at 681 Sea St, Quincy, MA 02169 and is currently estimated at $557,771, approximately $390 per square foot. 681 Sea St is a home located in Norfolk County with nearby schools including Atherton Hough Elementary School, Broad Meadows Middle School, and Quincy High School.
Ownership History
Date
Name
Owned For
Owner Type
Purchase Details
Closed on
Dec 1, 1995
Sold by
Johnston Patricia A
Bought by
Villacorta Marion L
Current Estimated Value
Home Financials for this Owner
Home Financials are based on the most recent Mortgage that was taken out on this home.
Original Mortgage
$117,500
Outstanding Balance
$2,404
Interest Rate
7.37%
Mortgage Type
Purchase Money Mortgage
Estimated Equity
$555,367
Purchase Details
Closed on
Aug 12, 1993
Sold by
Dsgn Built Form and Dsgn Cnst
Bought by
Johnston Patricia A
Home Financials for this Owner
Home Financials are based on the most recent Mortgage that was taken out on this home.
Original Mortgage
$102,600
Interest Rate
7.16%
Mortgage Type
Purchase Money Mortgage
Create a Home Valuation Report for This Property
The Home Valuation Report is an in-depth analysis detailing your home's value as well as a comparison with similar homes in the area
Home Values in the Area
Average Home Value in this Area
Purchase History
| Date | Buyer | Sale Price | Title Company |
|---|---|---|---|
| Villacorta Marion L | $122,000 | -- | |
| Villacorta Marlon L | $122,000 | -- | |
| Johnston Patricia A | $108,000 | -- |
Source: Public Records
Mortgage History
| Date | Status | Borrower | Loan Amount |
|---|---|---|---|
| Open | Villacorta Marlon L | $117,500 | |
| Closed | Johnston Patricia A | $117,500 | |
| Previous Owner | Johnston Patricia A | $102,600 |
Source: Public Records
Tax History Compared to Growth
Tax History
| Year | Tax Paid | Tax Assessment Tax Assessment Total Assessment is a certain percentage of the fair market value that is determined by local assessors to be the total taxable value of land and additions on the property. | Land | Improvement |
|---|---|---|---|---|
| 2025 | $5,085 | $441,000 | $0 | $441,000 |
| 2024 | $4,744 | $420,900 | $0 | $420,900 |
| 2023 | $4,382 | $393,700 | $0 | $393,700 |
| 2022 | $4,395 | $366,900 | $0 | $366,900 |
| 2021 | $4,254 | $350,400 | $0 | $350,400 |
| 2020 | $4,135 | $332,700 | $0 | $332,700 |
| 2019 | $4,007 | $319,300 | $0 | $319,300 |
| 2018 | $4,138 | $310,200 | $0 | $310,200 |
| 2017 | $4,129 | $291,400 | $0 | $291,400 |
| 2016 | $3,965 | $276,100 | $0 | $276,100 |
| 2015 | $3,943 | $270,100 | $0 | $270,100 |
| 2014 | $3,734 | $251,300 | $0 | $251,300 |
Source: Public Records
Map
Nearby Homes