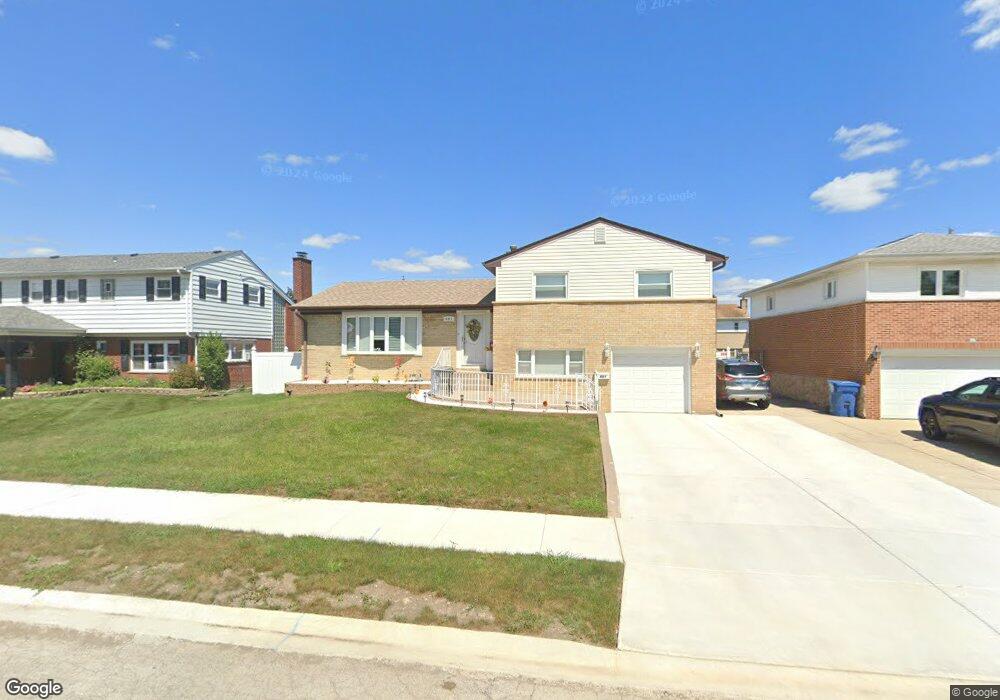
681 Sherman St Melrose Park, IL 60160
North Maywood NeighborhoodEstimated Value: $362,000 - $387,000
3
Beds
2
Baths
1,827
Sq Ft
$207/Sq Ft
Est. Value
About This Home
This home is located at 681 Sherman St, Melrose Park, IL 60160 and is currently estimated at $378,371, approximately $207 per square foot. 681 Sherman St is a home located in Cook County with nearby schools including Jane Addams Elementary School, Stevenson Middle School, and Proviso East High School.
Ownership History
Date
Name
Owned For
Owner Type
Purchase Details
Closed on
Jun 12, 2017
Sold by
Bruno Bernard J
Bought by
Villegas Roman
Current Estimated Value
Purchase Details
Closed on
Dec 23, 2016
Sold by
Bruno Bernard J
Bought by
Villegas Roman
Purchase Details
Closed on
Nov 9, 2005
Sold by
Theodore Brandon
Bought by
Bruno Bernard and Bruno Rosemarie
Purchase Details
Closed on
Aug 10, 2005
Sold by
Dunkovich William J and Dunkovich Mary Lou L
Bought by
Theodore Brandon
Home Financials for this Owner
Home Financials are based on the most recent Mortgage that was taken out on this home.
Original Mortgage
$192,000
Interest Rate
2.12%
Mortgage Type
New Conventional
Purchase Details
Closed on
May 24, 2004
Sold by
Dunkovich William J and Dunkovich Mary L
Bought by
Dunkovich William J and Dunkovich Mary L
Home Financials for this Owner
Home Financials are based on the most recent Mortgage that was taken out on this home.
Original Mortgage
$158,000
Interest Rate
7.7%
Mortgage Type
New Conventional
Create a Home Valuation Report for This Property
The Home Valuation Report is an in-depth analysis detailing your home's value as well as a comparison with similar homes in the area
Home Values in the Area
Average Home Value in this Area
Purchase History
| Date | Buyer | Sale Price | Title Company |
|---|---|---|---|
| Villegas Roman | -- | None Available | |
| Villegas Roman | -- | None Available | |
| Bruno Bernard J | -- | None Available | |
| Bruno Bernard | $320,000 | Premier Title | |
| Theodore Brandon | $240,000 | Chicago Title Insurance Comp | |
| Dunkovich William J | -- | Nations Title Agency |
Source: Public Records
Mortgage History
| Date | Status | Borrower | Loan Amount |
|---|---|---|---|
| Previous Owner | Theodore Brandon | $192,000 | |
| Previous Owner | Dunkovich William J | $158,000 |
Source: Public Records
Tax History Compared to Growth
Tax History
| Year | Tax Paid | Tax Assessment Tax Assessment Total Assessment is a certain percentage of the fair market value that is determined by local assessors to be the total taxable value of land and additions on the property. | Land | Improvement |
|---|---|---|---|---|
| 2024 | $2,393 | $30,000 | $4,550 | $25,450 |
| 2023 | $3,138 | $30,000 | $4,550 | $25,450 |
| 2022 | $3,138 | $22,517 | $3,900 | $18,617 |
| 2021 | $6,003 | $22,517 | $3,900 | $18,617 |
| 2020 | $5,905 | $22,517 | $3,900 | $18,617 |
| 2019 | $5,388 | $20,050 | $3,575 | $16,475 |
| 2018 | $6,476 | $20,050 | $3,575 | $16,475 |
| 2017 | $3,173 | $20,050 | $3,575 | $16,475 |
| 2016 | $4,090 | $17,903 | $3,250 | $14,653 |
| 2015 | $4,230 | $17,903 | $3,250 | $14,653 |
| 2014 | $5,473 | $17,903 | $3,250 | $14,653 |
| 2013 | $4,358 | $20,032 | $3,250 | $16,782 |
Source: Public Records
Map
Nearby Homes
- 1118 N 6th Ave
- 1401 N 5th Ave
- 291 Division St
- 1200 N 11th Ave
- 1114 N 11th Ave
- 619 N 4th Ave
- 1209 Helen Dr
- 918 Park Dr
- 1202 Elsie Dr
- 1616 N 12th Ave
- 613 Huron St
- 1303 Rice St
- 1630 N 15th Ave
- 407 N 2nd Ave
- 105 N 12th Ave
- 1718 N 15th Ave
- 1650 Riverwoods Dr Unit 503
- 1650 Riverwoods Dr Unit 205
- 1700 Riverwoods Dr Unit 517
- 1700 Riverwoods Dr Unit 314