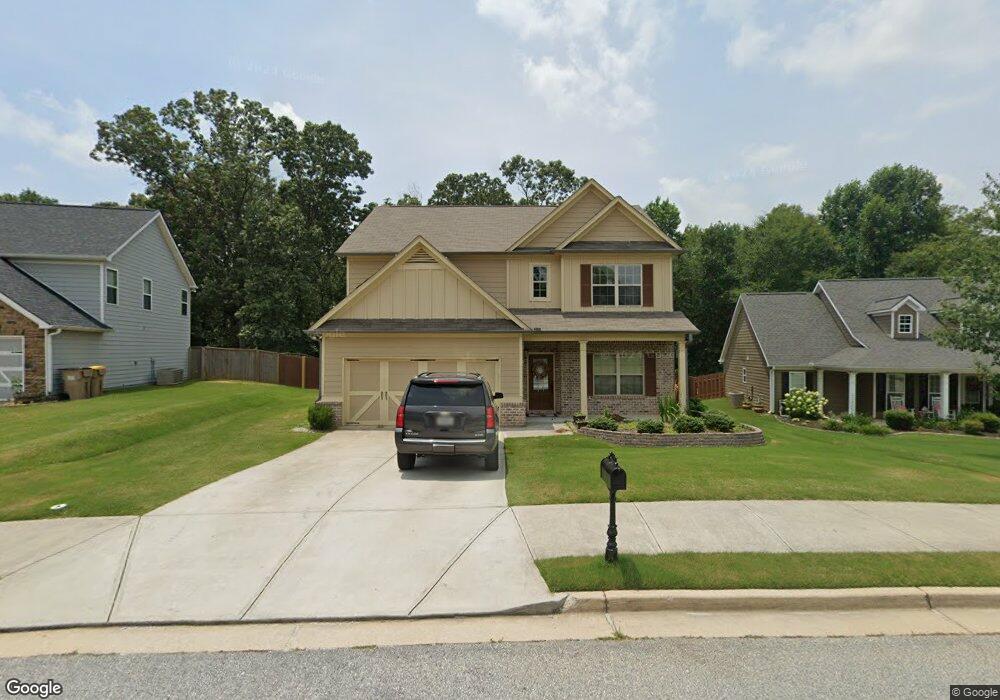
681 Wellford Ave Unit 23B Jefferson, GA 30549
Estimated Value: $408,000 - $462,000
4
Beds
3
Baths
2,223
Sq Ft
$193/Sq Ft
Est. Value
About This Home
This home is located at 681 Wellford Ave Unit 23B, Jefferson, GA 30549 and is currently estimated at $428,048, approximately $192 per square foot. 681 Wellford Ave Unit 23B is a home located in Jackson County with nearby schools including Gum Springs Elementary School, West Jackson Middle School, and Jackson County High School.
Ownership History
Date
Name
Owned For
Owner Type
Purchase Details
Closed on
Jan 13, 2020
Sold by
Marchbanks Clayton Jed
Bought by
Crowe James and Crowe Amanda
Current Estimated Value
Home Financials for this Owner
Home Financials are based on the most recent Mortgage that was taken out on this home.
Original Mortgage
$238,900
Outstanding Balance
$211,605
Interest Rate
3.73%
Mortgage Type
VA
Estimated Equity
$216,443
Purchase Details
Closed on
May 8, 2017
Sold by
Mb Endeavors Llc
Bought by
Marchbanks Clayton Jed and Marchbanks Whitney Erin
Home Financials for this Owner
Home Financials are based on the most recent Mortgage that was taken out on this home.
Original Mortgage
$211,007
Interest Rate
4.37%
Mortgage Type
FHA
Purchase Details
Closed on
Jun 17, 2016
Sold by
Ucb Lots Llc
Bought by
Mb Endeavors Llc
Purchase Details
Closed on
Apr 28, 2011
Sold by
United Community Bank
Bought by
Ucb Lots Llc
Purchase Details
Closed on
Sep 13, 2010
Sold by
Knight Group Inc The
Bought by
United Community Bank
Purchase Details
Closed on
May 20, 2008
Sold by
The Knight Grp Inc
Bought by
Georges James R
Purchase Details
Closed on
Jun 16, 2005
Sold by
Kaufman Ada C
Bought by
The Knight Grp Inc
Create a Home Valuation Report for This Property
The Home Valuation Report is an in-depth analysis detailing your home's value as well as a comparison with similar homes in the area
Home Values in the Area
Average Home Value in this Area
Purchase History
| Date | Buyer | Sale Price | Title Company |
|---|---|---|---|
| Crowe James | $238,900 | -- | |
| Marchbanks Clayton Jed | $214,900 | -- | |
| Mb Endeavors Llc | $30,341 | -- | |
| Ucb Lots Llc | $500 | -- | |
| United Community Bank | -- | -- | |
| Georges James R | $172,060 | -- | |
| The Knight Grp Inc | $767,000 | -- |
Source: Public Records
Mortgage History
| Date | Status | Borrower | Loan Amount |
|---|---|---|---|
| Open | Crowe James | $238,900 | |
| Previous Owner | Marchbanks Clayton Jed | $211,007 |
Source: Public Records
Tax History Compared to Growth
Tax History
| Year | Tax Paid | Tax Assessment Tax Assessment Total Assessment is a certain percentage of the fair market value that is determined by local assessors to be the total taxable value of land and additions on the property. | Land | Improvement |
|---|---|---|---|---|
| 2024 | $3,956 | $151,360 | $24,800 | $126,560 |
| 2023 | $3,956 | $136,040 | $24,800 | $111,240 |
| 2022 | $3,319 | $113,200 | $24,800 | $88,400 |
| 2021 | $2,824 | $102,000 | $13,600 | $88,400 |
| 2020 | $3,067 | $93,240 | $13,600 | $79,640 |
| 2019 | $3,112 | $93,240 | $13,600 | $79,640 |
| 2018 | $2,910 | $89,480 | $13,600 | $75,880 |
| 2017 | $1,640 | $54,512 | $13,600 | $40,912 |
| 2016 | $153 | $2,200 | $2,200 | $0 |
| 2015 | $153 | $2,200 | $2,200 | $0 |
| 2014 | $153 | $2,200 | $2,200 | $0 |
| 2013 | -- | $2,200 | $2,200 | $0 |
Source: Public Records
Map
Nearby Homes
- 41 Doster Crest Rd
- 847 Wellford Ave
- 3834 Highway 124 W
- 265 Laurel Cove Dr
- 79 White Plains Church Rd
- 565 Skelton Rd
- 86 Cottonwood Rd
- 1084 Skelton Rd
- 113 Skelton Rd
- 335 Jones Rd
- 241 Jones Rd
- 2932 Highway 124 W
- 144 Braselton Farms Dr
- 77 Wildcherry Ct
- 0 Creek Nation Rd Unit TRACT 2
- 0 Creek Nation Rd Unit 10599350
- 257 Winding Ridge Trail
- 257 Winding Ridge Trail Unit LOT 14
- 463 Delaperriere Loop
- 241 Winding Ridge Trail Unit LOT 13
- 681 Wellford Ave
- 693 Wellford Ave
- 665 Wellford Ave
- 0 Wellford Ave Unit 8813774
- 0 Wellford Ave Unit 8566938
- 0 Wellford Ave Unit 8180846
- 0 Wellford Ave Unit 8799111
- 0 Wellford Ave Unit 8897056
- 0 Wellford Ave Unit 8902190
- 0 Wellford Ave Unit 7365136
- 657 Wellford Ave Unit 21B
- 657 Wellford Ave
- 703 Wellford Ave
- 678 Wellford Ave
- 700 Wellford Ave Unit 52
- 700 Wellford Ave
- 645 Wellford Ave Unit 20
- 711 Wellford Ave Unit 26
- 711 Wellford Ave
- 656 Wellford Ave