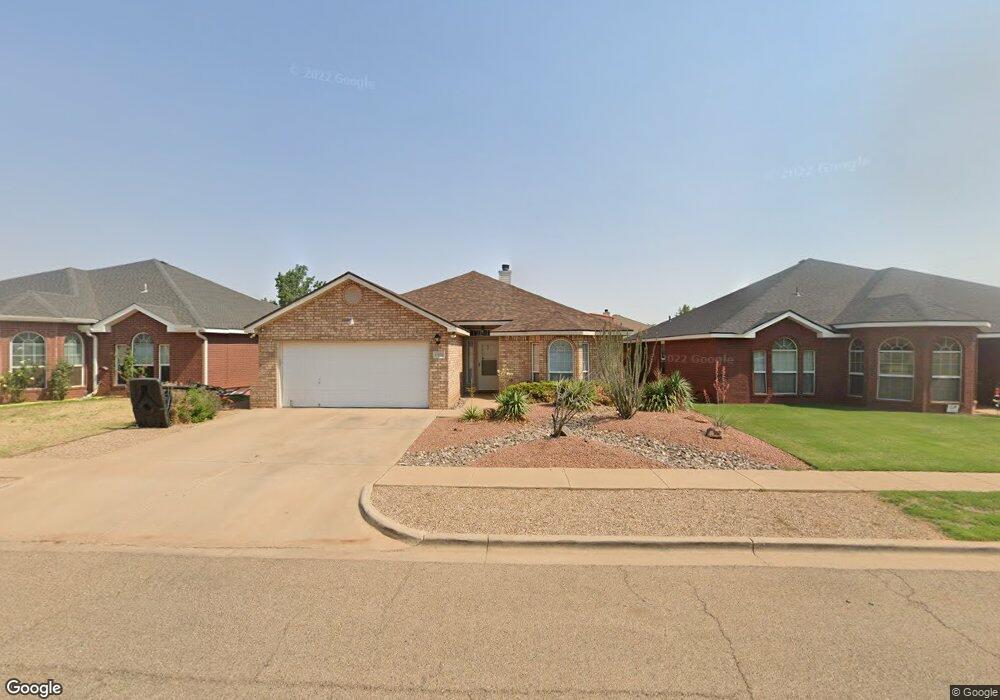
6810 86th St Lubbock, TX 79424
Estimated Value: $223,599 - $236,000
3
Beds
2
Baths
1,931
Sq Ft
$119/Sq Ft
Est. Value
About This Home
This home is located at 6810 86th St, Lubbock, TX 79424 and is currently estimated at $230,650, approximately $119 per square foot. 6810 86th St is a home located in Lubbock County with nearby schools including Oak Ridge Elementary School, Heritage Middle School, and Frenship High School.
Ownership History
Date
Name
Owned For
Owner Type
Purchase Details
Closed on
Jun 26, 2006
Sold by
Rivera Cora Sue and Thompson Cora Sue
Bought by
Rivera David
Current Estimated Value
Home Financials for this Owner
Home Financials are based on the most recent Mortgage that was taken out on this home.
Original Mortgage
$104,890
Outstanding Balance
$61,874
Interest Rate
6.63%
Mortgage Type
Purchase Money Mortgage
Estimated Equity
$168,776
Purchase Details
Closed on
Jul 2, 2004
Sold by
Monterey I Ltd
Bought by
Rivera David
Purchase Details
Closed on
May 31, 2003
Sold by
Quality Land Devlpmnt Ltd
Bought by
Rivera David
Create a Home Valuation Report for This Property
The Home Valuation Report is an in-depth analysis detailing your home's value as well as a comparison with similar homes in the area
Home Values in the Area
Average Home Value in this Area
Purchase History
| Date | Buyer | Sale Price | Title Company |
|---|---|---|---|
| Rivera David | -- | None Available | |
| Rivera David | -- | -- | |
| Rivera David | -- | -- |
Source: Public Records
Mortgage History
| Date | Status | Borrower | Loan Amount |
|---|---|---|---|
| Open | Rivera David | $104,890 |
Source: Public Records
Tax History Compared to Growth
Tax History
| Year | Tax Paid | Tax Assessment Tax Assessment Total Assessment is a certain percentage of the fair market value that is determined by local assessors to be the total taxable value of land and additions on the property. | Land | Improvement |
|---|---|---|---|---|
| 2025 | $4,318 | $207,338 | $8,000 | $199,338 |
| 2024 | $4,318 | $209,182 | $8,000 | $201,182 |
| 2023 | $4,517 | $215,687 | $8,000 | $207,687 |
| 2022 | $4,326 | $190,019 | $8,000 | $182,019 |
| 2021 | $4,231 | $174,970 | $8,000 | $166,970 |
| 2020 | $3,943 | $162,288 | $8,000 | $154,288 |
| 2019 | $3,979 | $159,169 | $8,000 | $151,169 |
| 2018 | $3,934 | $157,186 | $8,000 | $149,186 |
| 2017 | $3,792 | $151,311 | $8,000 | $143,311 |
| 2016 | $3,704 | $147,827 | $8,000 | $139,827 |
| 2015 | $2,900 | $138,187 | $8,000 | $130,187 |
| 2014 | $2,900 | $129,673 | $8,000 | $121,673 |
Source: Public Records
Map
Nearby Homes