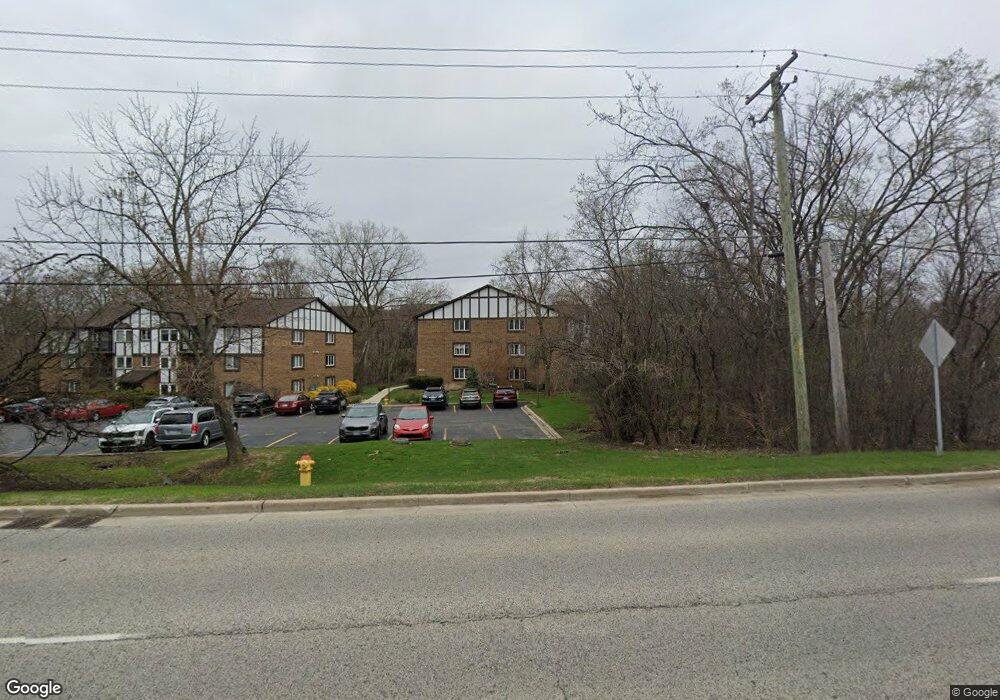
6810 Joliet Rd Unit 1 Indian Head Park, IL 60525
Estimated Value: $217,060 - $237,000
2
Beds
2
Baths
48,010
Sq Ft
$5/Sq Ft
Est. Value
About This Home
This home is located at 6810 Joliet Rd Unit 1, Indian Head Park, IL 60525 and is currently estimated at $226,765, approximately $4 per square foot. 6810 Joliet Rd Unit 1 is a home located in Cook County with nearby schools including Highlands Elementary School, Highlands Middle School, and Lyons Township High School.
Ownership History
Date
Name
Owned For
Owner Type
Purchase Details
Closed on
Feb 7, 2008
Sold by
Vannucci Frank F and Vannucci Dawn R
Bought by
Rosenbeck Kathleen
Current Estimated Value
Home Financials for this Owner
Home Financials are based on the most recent Mortgage that was taken out on this home.
Original Mortgage
$110,000
Outstanding Balance
$68,252
Interest Rate
5.75%
Mortgage Type
Purchase Money Mortgage
Estimated Equity
$158,513
Purchase Details
Closed on
Mar 21, 1997
Sold by
Rychlec Gail and Rychlec Irving J
Bought by
Vannucci Frank and Vannucci Dawn R
Home Financials for this Owner
Home Financials are based on the most recent Mortgage that was taken out on this home.
Original Mortgage
$97,375
Interest Rate
6%
Purchase Details
Closed on
Aug 30, 1994
Sold by
Anderson Ruth T
Bought by
Rychlec Gail and Rychlec Irving J
Home Financials for this Owner
Home Financials are based on the most recent Mortgage that was taken out on this home.
Original Mortgage
$85,150
Interest Rate
6.87%
Create a Home Valuation Report for This Property
The Home Valuation Report is an in-depth analysis detailing your home's value as well as a comparison with similar homes in the area
Home Values in the Area
Average Home Value in this Area
Purchase History
| Date | Buyer | Sale Price | Title Company |
|---|---|---|---|
| Rosenbeck Kathleen | $170,000 | First American Title | |
| Vannucci Frank | $102,500 | -- | |
| Rychlec Gail | $96,500 | -- |
Source: Public Records
Mortgage History
| Date | Status | Borrower | Loan Amount |
|---|---|---|---|
| Open | Rosenbeck Kathleen | $110,000 | |
| Previous Owner | Vannucci Frank | $97,375 | |
| Previous Owner | Rychlec Gail | $85,150 |
Source: Public Records
Tax History Compared to Growth
Tax History
| Year | Tax Paid | Tax Assessment Tax Assessment Total Assessment is a certain percentage of the fair market value that is determined by local assessors to be the total taxable value of land and additions on the property. | Land | Improvement |
|---|---|---|---|---|
| 2024 | $2,720 | $15,130 | $1,488 | $13,642 |
| 2023 | $2,424 | $15,130 | $1,488 | $13,642 |
| 2022 | $2,424 | $12,263 | $2,054 | $10,209 |
| 2021 | $2,328 | $12,261 | $2,053 | $10,208 |
| 2020 | $2,331 | $12,261 | $2,053 | $10,208 |
| 2019 | $1,150 | $7,931 | $1,875 | $6,056 |
| 2018 | $1,127 | $7,931 | $1,875 | $6,056 |
| 2017 | $1,110 | $7,931 | $1,875 | $6,056 |
| 2016 | $1,482 | $7,981 | $1,637 | $6,344 |
| 2015 | $1,425 | $7,981 | $1,637 | $6,344 |
| 2014 | $1,420 | $7,981 | $1,637 | $6,344 |
| 2013 | $2,659 | $13,293 | $1,637 | $11,656 |
Source: Public Records
Map
Nearby Homes
- 127 Acacia Cir Unit 505
- 111 Acacia Dr Unit 508
- 6818 Joliet Rd Unit 9
- 4 Potawatomie Trail Unit 4
- 7445 Willow Springs Rd
- 164 Cascade Dr
- 170 Cascade Dr
- 191 Cascade Dr
- 6441 Blackhawk Trail
- 10725 Forestview Rd
- 6262 Edgebrook Ln E
- 6213 Edgebrook Ln W
- 1140 64th St Unit 6
- 11407 Hiawatha Ln
- 7001 Sunset Ave
- 6630 S Brainard Ave Unit PT203
- 6670 S Brainard Ave Unit 402
- 11300 Sequoya Ln
- 94 Hawthorne Dr
- 6660 S Brainard Ave Unit 103
- 6810 Joliet Rd Unit 68105
- 6810 Joliet Rd Unit 68109
- 6810 Joliet Rd Unit 68101
- 6810 Joliet Rd Unit 68106
- 6810 Joliet Rd Unit 68103
- 6810 Joliet Rd Unit 68102
- 6810 Joliet Rd Unit 68104
- 6810 Joliet Rd Unit 681011
- 6810 Joliet Rd Unit 68108
- 6810 Joliet Rd Unit 68107
- 6810 Joliet Rd Unit 681012
- 6810 Joliet Rd Unit 681010
- 6810 Joliet Rd Unit 6
- 6810 Joliet Rd Unit 5
- 6810 Joliet Rd Unit 3
- 6810 Joliet Rd Unit 2
- 6810 Joliet Rd Unit 9
- 6810 Joliet Rd Unit 11
- 6810 Joliet Rd Unit 7
- 6812 Joliet Rd Unit 4