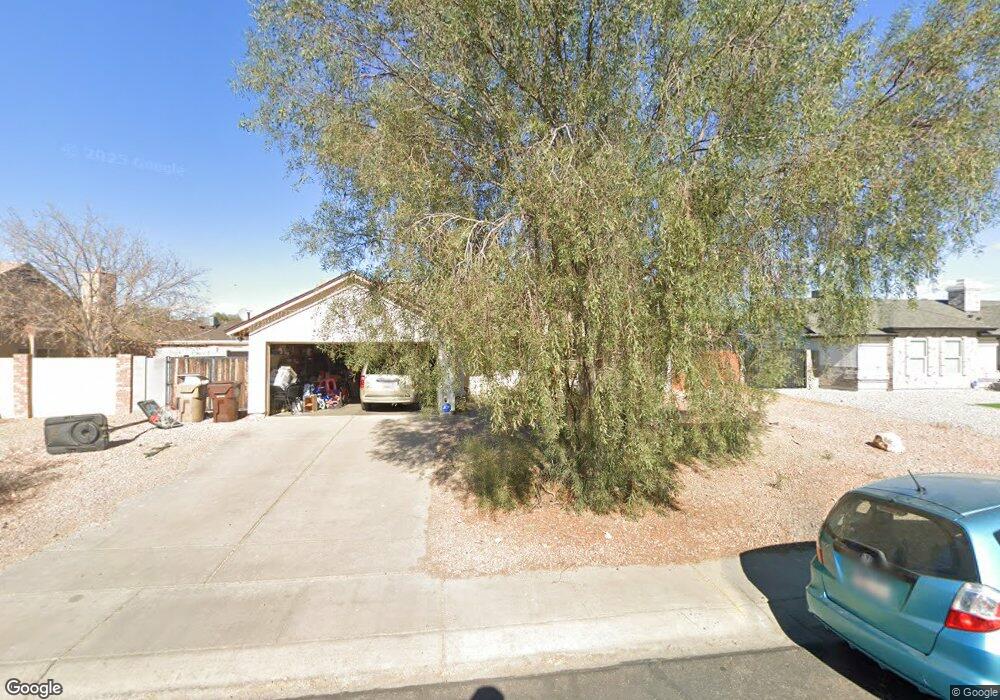
6810 W Brown St Peoria, AZ 85345
Estimated Value: $305,865 - $385,000
3
Beds
2
Baths
1,350
Sq Ft
$259/Sq Ft
Est. Value
About This Home
This home is located at 6810 W Brown St, Peoria, AZ 85345 and is currently estimated at $349,216, approximately $258 per square foot. 6810 W Brown St is a home located in Maricopa County with nearby schools including Ira A Murphy Elementary School and Centennial High School.
Ownership History
Date
Name
Owned For
Owner Type
Purchase Details
Closed on
Aug 21, 2014
Sold by
Johnson Stephen R and Johnson Dina L
Bought by
Johnson Stephen R
Current Estimated Value
Home Financials for this Owner
Home Financials are based on the most recent Mortgage that was taken out on this home.
Original Mortgage
$140,910
Outstanding Balance
$107,403
Interest Rate
4.1%
Mortgage Type
New Conventional
Estimated Equity
$241,813
Purchase Details
Closed on
Jul 14, 2003
Sold by
Bird Lori Ann
Bought by
Johnson Stephen R
Home Financials for this Owner
Home Financials are based on the most recent Mortgage that was taken out on this home.
Original Mortgage
$124,900
Interest Rate
5.22%
Mortgage Type
VA
Purchase Details
Closed on
Oct 18, 1994
Sold by
Toone Steven G and Toone Leeann
Bought by
Bird Lori Ann
Home Financials for this Owner
Home Financials are based on the most recent Mortgage that was taken out on this home.
Original Mortgage
$80,580
Interest Rate
8.7%
Mortgage Type
VA
Create a Home Valuation Report for This Property
The Home Valuation Report is an in-depth analysis detailing your home's value as well as a comparison with similar homes in the area
Home Values in the Area
Average Home Value in this Area
Purchase History
| Date | Buyer | Sale Price | Title Company |
|---|---|---|---|
| Johnson Stephen R | -- | Equity Title Agency | |
| Johnson Stephen R | $124,900 | Equity Title Agency Inc | |
| Bird Lori Ann | $81,000 | Network Escrow & Title Agenc |
Source: Public Records
Mortgage History
| Date | Status | Borrower | Loan Amount |
|---|---|---|---|
| Open | Johnson Stephen R | $140,910 | |
| Closed | Johnson Stephen R | $124,900 | |
| Previous Owner | Bird Lori Ann | $80,580 |
Source: Public Records
Tax History Compared to Growth
Tax History
| Year | Tax Paid | Tax Assessment Tax Assessment Total Assessment is a certain percentage of the fair market value that is determined by local assessors to be the total taxable value of land and additions on the property. | Land | Improvement |
|---|---|---|---|---|
| 2025 | $855 | $10,989 | -- | -- |
| 2024 | $843 | $10,466 | -- | -- |
| 2023 | $843 | $26,270 | $5,250 | $21,020 |
| 2022 | $825 | $20,160 | $4,030 | $16,130 |
| 2021 | $883 | $18,530 | $3,700 | $14,830 |
| 2020 | $892 | $17,610 | $3,520 | $14,090 |
| 2019 | $863 | $15,920 | $3,180 | $12,740 |
| 2018 | $834 | $14,580 | $2,910 | $11,670 |
| 2017 | $835 | $12,400 | $2,480 | $9,920 |
| 2016 | $826 | $10,980 | $2,190 | $8,790 |
| 2015 | $771 | $10,100 | $2,020 | $8,080 |
Source: Public Records
Map
Nearby Homes
- 6638 W Cinnabar Ave
- 10002 N 66th Ln
- 6854 W Ironwood Dr
- 6626 W Cinnabar Ave
- 6622 W Cinnabar Ave
- 10018 N 66th Ave
- 6931 W Beryl Ave
- 6614 W Mountain View Rd
- 7001 W North Ln
- 9540 N 66th Dr
- 6604 W Vogel Ave
- 6534 W North Ln
- 7115 W Brown St
- 9459 N 64th Dr Unit 2
- 7136 W Cheryl Dr
- 6960 W Peoria Ave Unit 225
- 6960 W Peoria Ave Unit 2
- 6960 W Peoria Ave Unit 201
- 6960 W Peoria Ave Unit 67
- 6960 W Peoria Ave Unit 59
- 6766 W Brown St
- 6818 W Brown St Unit 7
- 6811 W Cheryl Dr
- 6819 W Cheryl Dr
- 6767 W Cheryl Dr
- 6758 W Brown St
- 6826 W Brown St
- 6809 W Brown St
- 6765 W Brown St
- 6817 W Brown St
- 6827 W Cheryl Dr
- 6759 W Cheryl Dr
- 6757 W Brown St
- 6825 W Brown St
- 6750 W Brown St
- 6834 W Brown St
- 6835 W Cheryl Dr
- 6751 W Cheryl Dr
- 6808 W Cinnabar Ave Unit VII
- 6764 W Cinnabar Ave