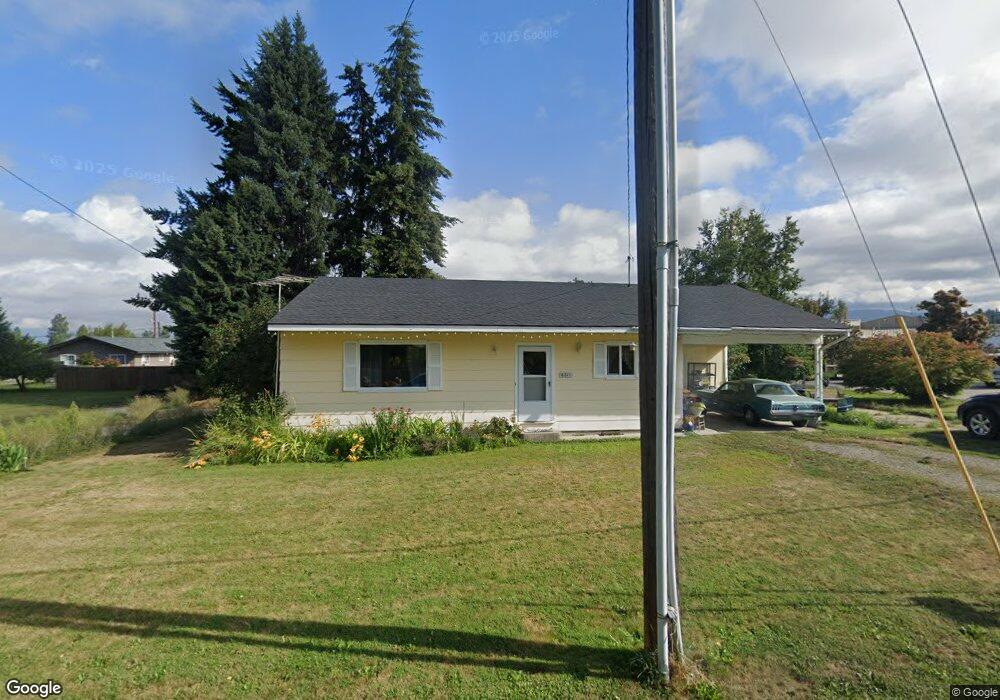
6811 Eisenhower St Bonners Ferry, ID 83805
Estimated Value: $282,727 - $331,000
2
Beds
1
Bath
1,290
Sq Ft
$233/Sq Ft
Est. Value
About This Home
This home is located at 6811 Eisenhower St, Bonners Ferry, ID 83805 and is currently estimated at $299,932, approximately $232 per square foot. 6811 Eisenhower St is a home located in Boundary County with nearby schools including Bonners Ferry High School and Kootenai Valley Mennonite Church.
Ownership History
Date
Name
Owned For
Owner Type
Purchase Details
Closed on
Jan 11, 2021
Sold by
Henslee Alison G
Bought by
Henslee Alison
Current Estimated Value
Home Financials for this Owner
Home Financials are based on the most recent Mortgage that was taken out on this home.
Original Mortgage
$136,500
Outstanding Balance
$121,827
Interest Rate
2.71%
Mortgage Type
New Conventional
Estimated Equity
$178,105
Purchase Details
Closed on
May 20, 2016
Sold by
Furtado Nancy Ann
Bought by
Henslee Alison G
Home Financials for this Owner
Home Financials are based on the most recent Mortgage that was taken out on this home.
Original Mortgage
$96,000
Interest Rate
3.59%
Mortgage Type
Unknown
Purchase Details
Closed on
Mar 30, 2005
Sold by
Rockford Walter J and Rockford Joann
Bought by
Mchone Nancy A
Home Financials for this Owner
Home Financials are based on the most recent Mortgage that was taken out on this home.
Original Mortgage
$58,800
Interest Rate
6%
Mortgage Type
Adjustable Rate Mortgage/ARM
Create a Home Valuation Report for This Property
The Home Valuation Report is an in-depth analysis detailing your home's value as well as a comparison with similar homes in the area
Home Values in the Area
Average Home Value in this Area
Purchase History
| Date | Buyer | Sale Price | Title Company |
|---|---|---|---|
| Henslee Alison | -- | Boundary Abstract Co Ltd | |
| Henslee Alison G | -- | Boundary Abstract Title | |
| Mchone Nancy A | -- | -- |
Source: Public Records
Mortgage History
| Date | Status | Borrower | Loan Amount |
|---|---|---|---|
| Open | Henslee Alison | $136,500 | |
| Closed | Henslee Alison G | $96,000 | |
| Previous Owner | Mchone Nancy A | $58,800 |
Source: Public Records
Tax History Compared to Growth
Tax History
| Year | Tax Paid | Tax Assessment Tax Assessment Total Assessment is a certain percentage of the fair market value that is determined by local assessors to be the total taxable value of land and additions on the property. | Land | Improvement |
|---|---|---|---|---|
| 2025 | $766 | $215,780 | $72,500 | $143,280 |
| 2024 | $766 | $215,020 | $72,500 | $142,520 |
| 2023 | $763 | $253,300 | $66,900 | $186,400 |
| 2022 | $965 | $250,360 | $53,800 | $196,560 |
| 2021 | $893 | $151,040 | $39,200 | $111,840 |
| 2020 | $893 | $141,560 | $36,500 | $105,060 |
| 2019 | $419 | $97,710 | $31,200 | $66,510 |
| 2018 | $818 | $92,590 | $31,200 | $61,390 |
| 2017 | $790 | $90,030 | $31,200 | $58,830 |
| 2016 | $1,316 | $77,940 | $31,200 | $46,740 |
| 2015 | $1,277 | $31,200 | $31,200 | $0 |
| 2014 | $1,181 | $31,200 | $31,200 | $0 |
| 2013 | -- | $31,200 | $31,200 | $0 |
Source: Public Records
Map
Nearby Homes
- 6840 Selkirk St
- 6850 Selkirk St
- 6856 Selkirk St
- 6885 Bauman St
- 6337 Mccall St
- 6647 Alderson Ln
- 6308 McCall St Lot #6
- 273 Paradise Valley Rd
- 6556 Tannenbaum Cir
- 6670 Buchanan St
- 6531 Tannenbaum Cir
- 6499 Van Buren St
- NNA Highway 95
- 515377 U S Route 95
- nna U S Route 95
- 53396 U S Route 95
- 485 Stellar Jay Rd
- 492 Stellar Jay Rd
- Tract 2 Deep Creak Loop Rd
- 6536 Main St
- 6797 Eisenhower St
- 6567 Sacramento St
- 6804 Truman St
- 6814 Eisenhower St
- 6818 Eisenhower St
- 2022 Bc Alley
- 6832 Eisenhower St
- 6833 Eisenhower St
- 6568 Sacramento St
- 6586 Truman St
- 6821 Truman St
- 6841 Eisenhower St
- 6551 Main St
- 6541 Main St
- 6514 Main St
- 6521 Walker Ln
- 6848 Eisenhower St
- 6849 Eisenhower St
- 6849 Truman St