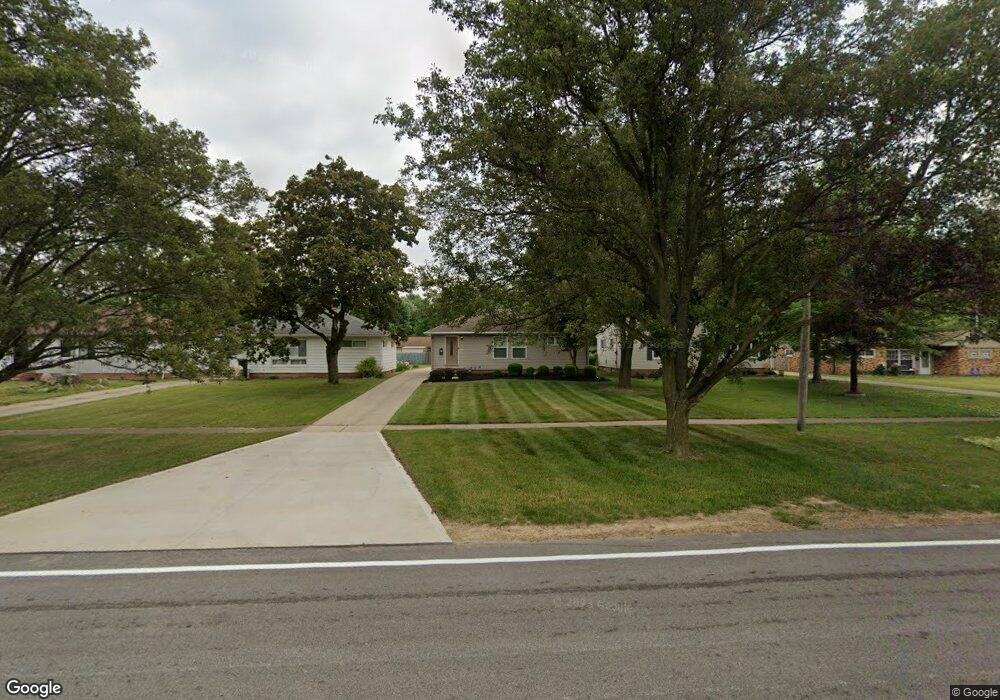
6811 Middlebrook Blvd Middleburg Heights, OH 44130
Estimated Value: $140,000 - $224,000
3
Beds
1
Bath
962
Sq Ft
$201/Sq Ft
Est. Value
About This Home
This home is located at 6811 Middlebrook Blvd, Middleburg Heights, OH 44130 and is currently estimated at $193,785, approximately $201 per square foot. 6811 Middlebrook Blvd is a home located in Cuyahoga County with nearby schools including Big Creek Elementary School, Berea-Midpark Middle School, and Berea-Midpark High School.
Ownership History
Date
Name
Owned For
Owner Type
Purchase Details
Closed on
Aug 3, 2017
Sold by
Lavalle Michele
Bought by
Ruggiero Dominec
Current Estimated Value
Purchase Details
Closed on
Jul 17, 2008
Sold by
Ruggiero Vincenzo
Bought by
Ruggiero Domenic and Lavalle Michele
Purchase Details
Closed on
Sep 5, 2007
Sold by
Ruggiero Michelina and Lavalle Paolo
Bought by
Ruggiero Vincenzo and Ruggiero Dominec
Purchase Details
Closed on
Jun 28, 2007
Sold by
Ruggiero Mario and Ruggiero Diane
Bought by
Ruggiero Michelina and Lavalle Paolo
Purchase Details
Closed on
Jun 18, 2007
Sold by
Dlj Mortgage Capital Inc
Bought by
Ruggiero Mario
Purchase Details
Closed on
Apr 19, 2007
Sold by
Cleary James P and Kanceki Diane Lee
Bought by
Dlj Mortgage Capital Inc
Purchase Details
Closed on
May 10, 1977
Sold by
Cleary James P and Kanecki D A
Bought by
Cleary James P
Purchase Details
Closed on
Jan 1, 1975
Bought by
Cleary James P and Cleary Kanecki D
Create a Home Valuation Report for This Property
The Home Valuation Report is an in-depth analysis detailing your home's value as well as a comparison with similar homes in the area
Home Values in the Area
Average Home Value in this Area
Purchase History
| Date | Buyer | Sale Price | Title Company |
|---|---|---|---|
| Ruggiero Dominec | $56,500 | Maximum Title | |
| Ruggiero Domenic | $23,350 | Accommodation | |
| Ruggiero Vincenzo | $70,000 | None Available | |
| Ruggiero Michelina | $70,000 | Maximum | |
| Ruggiero Mario | $70,000 | Resource Title Agency | |
| Dlj Mortgage Capital Inc | $76,667 | Attorney | |
| Cleary James P | -- | -- | |
| Cleary James P | -- | -- |
Source: Public Records
Tax History Compared to Growth
Tax History
| Year | Tax Paid | Tax Assessment Tax Assessment Total Assessment is a certain percentage of the fair market value that is determined by local assessors to be the total taxable value of land and additions on the property. | Land | Improvement |
|---|---|---|---|---|
| 2024 | $3,648 | $69,650 | $8,120 | $61,530 |
| 2023 | $3,154 | $49,570 | $12,010 | $37,560 |
| 2022 | $3,133 | $49,560 | $12,005 | $37,555 |
| 2021 | $3,115 | $49,560 | $12,010 | $37,560 |
| 2020 | $2,955 | $41,300 | $10,010 | $31,290 |
| 2019 | $2,871 | $118,000 | $28,600 | $89,400 |
| 2018 | $2,805 | $41,300 | $10,010 | $31,290 |
| 2017 | $2,968 | $39,660 | $8,160 | $31,500 |
| 2016 | $2,944 | $39,660 | $8,160 | $31,500 |
| 2015 | $2,772 | $39,660 | $8,160 | $31,500 |
| 2014 | $2,772 | $39,660 | $8,160 | $31,500 |
Source: Public Records
Map
Nearby Homes
- 6749 Middlebrook Blvd
- 6771 Wood Creek Dr
- 6736 Rockridge Ct
- 15510 Sandalhaven Dr
- 6710 Woodruff Ct
- 6809 Meadow Ln
- 6736 Columbine Ct
- 15446 Sheldon Rd
- 15983 Galemore Dr
- 6823 Fry Rd
- 6689 Fry Rd
- 6491 Smith Rd
- 16259 Emerald Point Unit 16259
- 16761 Orchard Grove Dr Unit 6808A
- 6943 N Parkway Dr Unit H6943
- 6566 Elmdale Rd
- 6359 Middlebrook Blvd
- 6470 Sandfield Dr
- 6724 Benedict Dr
- 6720 Benedict Dr
- 6807 Middlebrook Blvd
- 6815 Middlebrook Blvd
- 6803 Middlebrook Blvd
- 6819 Middlebrook Blvd
- 6799 Middlebrook Blvd
- 6838 Franke Rd
- 6842 Franke Rd
- 6848 Franke Rd
- 6834 Franke Rd
- 6795 Middlebrook Blvd
- 6844 Franke Rd
- 6830 Franke Rd
- 6793 Middlebrook Blvd
- 6829 Middlebrook Blvd
- 6854 Franke Rd
- 6810 Middlebrook Blvd
- 6816 Middlebrook Blvd
- 6789 Middlebrook Blvd
- 6822 Franke Rd
- 6858 Franke Rd