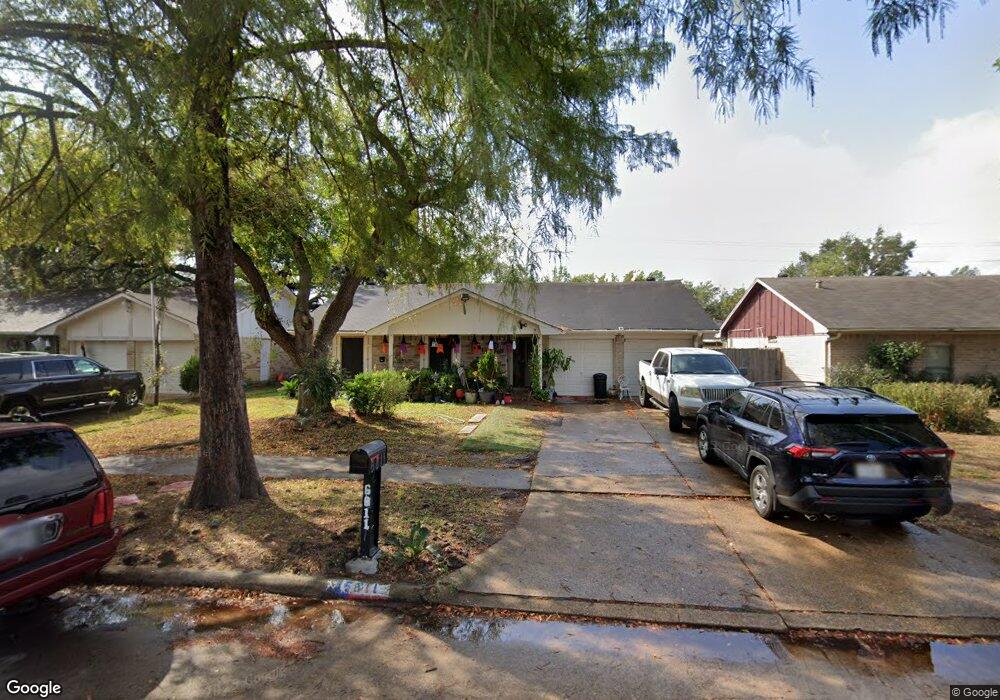
6811 Sandswept Ln Houston, TX 77086
North Houston NeighborhoodEstimated Value: $196,880 - $215,000
3
Beds
2
Baths
1,205
Sq Ft
$168/Sq Ft
Est. Value
About This Home
This home is located at 6811 Sandswept Ln, Houston, TX 77086 and is currently estimated at $202,720, approximately $168 per square foot. 6811 Sandswept Ln is a home located in Harris County with nearby schools including Kujawa EC/Pre-K/K School, Carmichael Elementary School, and Shotwell Middle School.
Ownership History
Date
Name
Owned For
Owner Type
Purchase Details
Closed on
Sep 29, 2009
Sold by
Hoang Mai and Nguyen Hai
Bought by
Rendon Santiago M and Rendon Maria Guadalupe
Current Estimated Value
Home Financials for this Owner
Home Financials are based on the most recent Mortgage that was taken out on this home.
Original Mortgage
$80,514
Outstanding Balance
$52,682
Interest Rate
5.12%
Mortgage Type
FHA
Estimated Equity
$150,038
Purchase Details
Closed on
May 15, 2003
Sold by
Hoang Kim Duyen and Tran Duc V
Bought by
Nguyen Hai and Hoang Mai
Home Financials for this Owner
Home Financials are based on the most recent Mortgage that was taken out on this home.
Original Mortgage
$56,000
Interest Rate
5.84%
Mortgage Type
Stand Alone First
Purchase Details
Closed on
Apr 18, 2002
Sold by
Hoang Son Xuan and Hoang Tuongvy H
Bought by
Tran Duc and Hoang Kim Duyen
Create a Home Valuation Report for This Property
The Home Valuation Report is an in-depth analysis detailing your home's value as well as a comparison with similar homes in the area
Home Values in the Area
Average Home Value in this Area
Purchase History
| Date | Buyer | Sale Price | Title Company |
|---|---|---|---|
| Rendon Santiago M | -- | Infinity Title Company | |
| Nguyen Hai | -- | Texas American Title Company | |
| Tran Duc | -- | -- |
Source: Public Records
Mortgage History
| Date | Status | Borrower | Loan Amount |
|---|---|---|---|
| Open | Rendon Santiago M | $80,514 | |
| Previous Owner | Nguyen Hai | $56,000 |
Source: Public Records
Tax History Compared to Growth
Tax History
| Year | Tax Paid | Tax Assessment Tax Assessment Total Assessment is a certain percentage of the fair market value that is determined by local assessors to be the total taxable value of land and additions on the property. | Land | Improvement |
|---|---|---|---|---|
| 2025 | $2,436 | $182,069 | $39,135 | $142,934 |
| 2024 | $2,436 | $184,670 | $39,135 | $145,535 |
| 2023 | $2,436 | $190,597 | $39,135 | $151,462 |
| 2022 | $3,199 | $158,812 | $33,165 | $125,647 |
| 2021 | $2,901 | $133,878 | $33,165 | $100,713 |
| 2020 | $2,932 | $124,840 | $33,165 | $91,675 |
| 2019 | $2,771 | $118,047 | $16,912 | $101,135 |
| 2018 | $930 | $110,423 | $16,912 | $93,511 |
| 2017 | $2,208 | $103,351 | $15,187 | $88,164 |
| 2016 | $2,008 | $93,940 | $15,187 | $78,753 |
| 2015 | $1,385 | $88,723 | $15,187 | $73,536 |
| 2014 | $1,385 | $66,753 | $15,187 | $51,566 |
Source: Public Records
Map
Nearby Homes
- 6911 Silver Star Dr
- 6722 Winding Trace Dr
- 7002 Sandswept Ln
- 6822 Dusty Dawn Dr
- 7023 Sandswept Ln
- 6615 Winding Trace Dr
- 6654 Brownie Campbell Rd
- 10306 Jillana Kaye Dr
- 6630 Brownie Campbell Rd
- 10522 Northview Dr
- 6502 Trail Valley Way
- 6830 Desert Rose Ln
- 10307 Bammel North Houston Rd
- 6703 Deer Ridge Ln
- 6606 Dusty Dawn Dr
- 6610 Northleaf Dr
- 7218 Winding Trace Dr
- 10614 Mackenzie Dr
- 10214 Trade Winds Dr
- 11007 Tobasa Ct
- 6807 Sandswept Ln
- 6815 Sandswept Ln
- 6902 Trail Valley Way
- 6803 Sandswept Ln
- 6819 Sandswept Ln
- 6826 Trail Valley Way
- 6906 Trail Valley Way
- 6822 Trail Valley Way
- 6814 Sandswept Ln
- 6810 Sandswept Ln
- 6910 Trail Valley Way
- 6727 Sandswept Ln
- 6823 Sandswept Ln
- 6818 Sandswept Ln
- 6806 Sandswept Ln
- 6818 Trail Valley Way
- 6914 Trail Valley Way
- 6822 Sandswept Ln
- 6802 Sandswept Ln
- 6827 Sandswept Ln