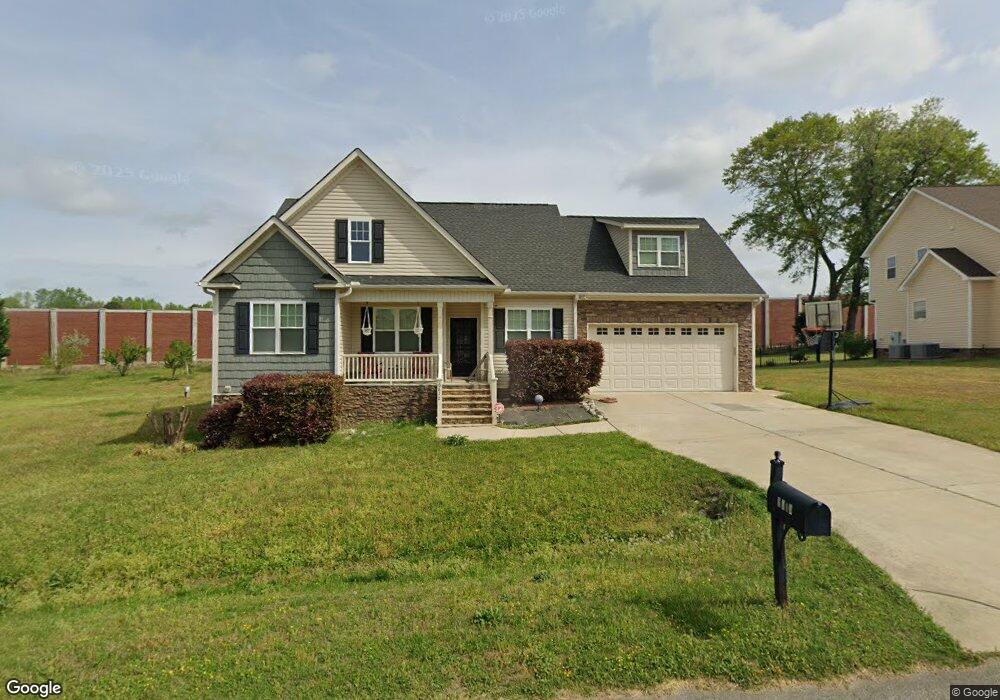
6812 Cali Ct Garner, NC 27529
Estimated Value: $426,824 - $450,000
Studio
--
Bath
2,127
Sq Ft
$206/Sq Ft
Est. Value
About This Home
This home is located at 6812 Cali Ct, Garner, NC 27529 and is currently estimated at $439,206, approximately $206 per square foot. 6812 Cali Ct is a home located in Wake County with nearby schools including Aversboro Elementary, North Garner Middle, and South Garner High.
Ownership History
Date
Name
Owned For
Owner Type
Purchase Details
Closed on
Aug 21, 2014
Sold by
Too Construction Co Inc
Bought by
Mardenborough David and Alston Mardenborough Montrella
Current Estimated Value
Home Financials for this Owner
Home Financials are based on the most recent Mortgage that was taken out on this home.
Original Mortgage
$234,671
Outstanding Balance
$176,497
Interest Rate
3.75%
Mortgage Type
FHA
Estimated Equity
$262,709
Purchase Details
Closed on
Apr 16, 2014
Sold by
Nikblair Properties Llc
Bought by
Too Construction Co Inc
Purchase Details
Closed on
Apr 15, 2014
Sold by
Shingleton Chad
Bought by
Too Construction Co Inc
Purchase Details
Closed on
Oct 22, 2013
Sold by
Leuver Construction Llc
Bought by
Nikblair Properties Llc
Purchase Details
Closed on
Oct 21, 2010
Sold by
Braswell Homes Inc
Bought by
First Federal Bank
Create a Home Valuation Report for This Property
The Home Valuation Report is an in-depth analysis detailing your home's value as well as a comparison with similar homes in the area
Home Values in the Area
Average Home Value in this Area
Purchase History
| Date | Buyer | Sale Price | Title Company |
|---|---|---|---|
| Mardenborough David | $239,000 | None Available | |
| Too Construction Co Inc | $35,000 | None Available | |
| Too Construction Co Inc | $35,000 | None Available | |
| Nikblair Properties Llc | $28,718 | None Available | |
| First Federal Bank | $86,000 | None Available |
Source: Public Records
Mortgage History
| Date | Status | Borrower | Loan Amount |
|---|---|---|---|
| Open | Mardenborough David | $234,671 |
Source: Public Records
Tax History
| Year | Tax Paid | Tax Assessment Tax Assessment Total Assessment is a certain percentage of the fair market value that is determined by local assessors to be the total taxable value of land and additions on the property. | Land | Improvement |
|---|---|---|---|---|
| 2025 | $2,744 | $425,832 | $90,000 | $335,832 |
| 2024 | $2,664 | $425,832 | $90,000 | $335,832 |
Source: Public Records
Map
Nearby Homes
- 3760 Wakefield Ln
- 101 Brody Pine Way
- 1017 Southern Trace Trail
- 1004 Snow Peak Ct
- 5441 Fantasy Moth Dr
- 7301 Cleveland School Rd
- 6313 Brack Penny Rd
- 5412 Treebound Ct
- 1509 Hoke Landing Ln
- 5405 Massengill Ct
- 1401 Hoke Landing Ln
- 1001 Retriever Ln
- 115 Birdie Dr
- 6500 Egrets Nest Ln
- 424 Thorny Branch Dr
- 1005 Winsome Ct
- 1205 Magnolia Hill Rd
- 106 Par Cir
- 1328 Red Brick Rd
- 489 Thorny Branch Dr
- 6812 Cali Ct Unit 95
- 6808 Cali Ct
- 6816 Cali Ct
- 3804 Cali Ct
- 3804 Cali Ct Unit 89
- 3804 Cali Ct Unit 97
- 6804 Cali Ct
- 6804 Cali Ct Unit 97
- 921 Open Field Dr
- 921 Open Field Dr Unit 92
- 929 Open Field Dr
- 6813 Cali Ct
- 6813 Cali Ct Unit 93
- 913 Open Field Dr
- 913 Open Field Dr Unit LT 90
- 933 Open Field Dr
- 933 Open Field Dr Unit LT 99
- 924 Open Field Dr
- 924 Open Field Dr Unit 75
- 920 Open Field Dr
Your Personal Tour Guide
Ask me questions while you tour the home.