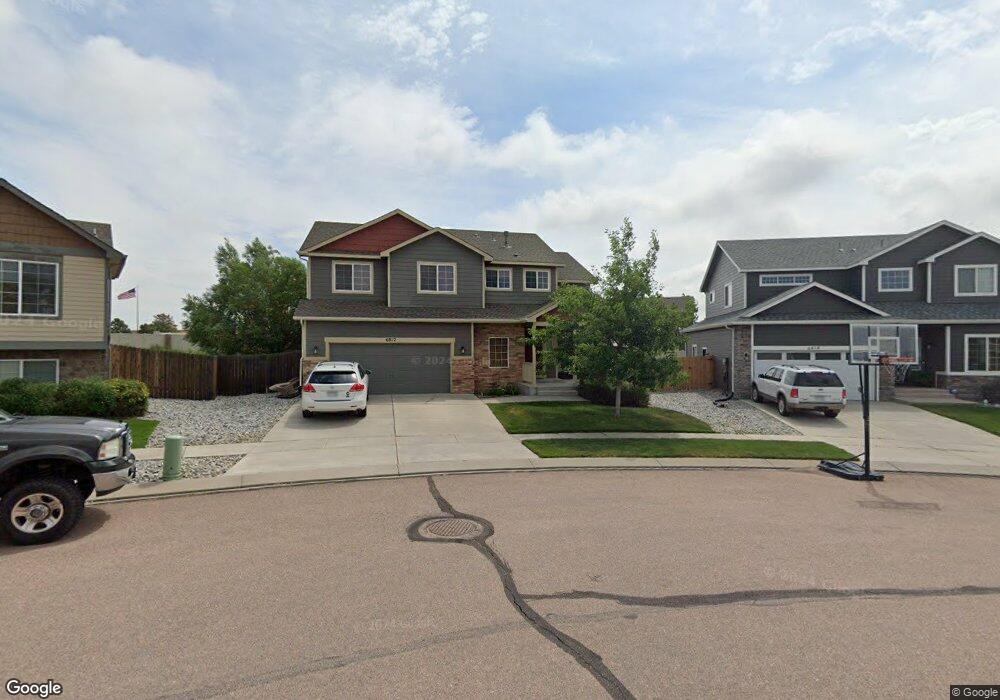
6812 Red Cardinal Loop Colorado Springs, CO 80908
Estimated Value: $469,041 - $537,000
3
Beds
3
Baths
2,414
Sq Ft
$207/Sq Ft
Est. Value
About This Home
This home is located at 6812 Red Cardinal Loop, Colorado Springs, CO 80908 and is currently estimated at $500,760, approximately $207 per square foot. 6812 Red Cardinal Loop is a home located in El Paso County with nearby schools including Inspiration View Elementary School, Skyview Middle School, and Vista Ridge High School.
Ownership History
Date
Name
Owned For
Owner Type
Purchase Details
Closed on
Jun 16, 2017
Sold by
Gaecther Marc A and Gaecther Julie
Bought by
Gaechter Marc A
Current Estimated Value
Home Financials for this Owner
Home Financials are based on the most recent Mortgage that was taken out on this home.
Original Mortgage
$234,432
Interest Rate
3.9%
Mortgage Type
FHA
Purchase Details
Closed on
Apr 19, 2017
Sold by
Gaeehter Maree A and Gaeehter Julie
Bought by
Gaeehter Mare A
Home Financials for this Owner
Home Financials are based on the most recent Mortgage that was taken out on this home.
Original Mortgage
$234,432
Interest Rate
3.9%
Mortgage Type
FHA
Purchase Details
Closed on
Jun 11, 2013
Sold by
Journey Homes Cs Llc
Bought by
Gaechter Marc A and Gaechter Julie
Home Financials for this Owner
Home Financials are based on the most recent Mortgage that was taken out on this home.
Original Mortgage
$199,084
Interest Rate
3.38%
Mortgage Type
New Conventional
Create a Home Valuation Report for This Property
The Home Valuation Report is an in-depth analysis detailing your home's value as well as a comparison with similar homes in the area
Home Values in the Area
Average Home Value in this Area
Purchase History
| Date | Buyer | Sale Price | Title Company |
|---|---|---|---|
| Gaechter Marc A | -- | None Available | |
| Gaeehter Mare A | -- | None Available | |
| Gaechter Marc A | $234,217 | Heritage Title |
Source: Public Records
Mortgage History
| Date | Status | Borrower | Loan Amount |
|---|---|---|---|
| Previous Owner | Gaechter Marc A | $234,432 | |
| Previous Owner | Gaechter Marc A | $199,084 |
Source: Public Records
Tax History Compared to Growth
Tax History
| Year | Tax Paid | Tax Assessment Tax Assessment Total Assessment is a certain percentage of the fair market value that is determined by local assessors to be the total taxable value of land and additions on the property. | Land | Improvement |
|---|---|---|---|---|
| 2025 | $2,684 | $33,710 | -- | -- |
| 2024 | $3,016 | $32,510 | $6,030 | $26,480 |
| 2023 | $3,016 | $32,510 | $6,030 | $26,480 |
| 2022 | $2,529 | $22,630 | $5,590 | $17,040 |
| 2021 | $2,704 | $23,290 | $5,760 | $17,530 |
| 2020 | $2,642 | $21,120 | $5,010 | $16,110 |
| 2019 | $2,701 | $21,120 | $5,010 | $16,110 |
| 2018 | $2,283 | $18,090 | $4,320 | $13,770 |
| 2017 | $2,290 | $18,090 | $4,320 | $13,770 |
| 2016 | $2,277 | $18,590 | $4,140 | $14,450 |
| 2015 | $2,317 | $18,590 | $4,140 | $14,450 |
| 2014 | $2,296 | $18,230 | $4,140 | $14,090 |
Source: Public Records
Map
Nearby Homes
- 6806 Red Cardinal Loop
- 6829 Red Cardinal Loop
- 7991 Martinwood Place
- 7983 Martinwood Place
- 7913 Dry Willow Way
- 7718 Wagonwood Place
- 8127 Mockorange Heights
- 7923 Wagonwood Place
- 7930 Lightwood Way
- 8294 Hardwood Cir
- 7557 Black Spruce Heights
- 7587 Black Spruce Heights
- 7834 Tuscan Sun Ct
- 7810 Tuscan Sun Ct
- 8308 Needle Drop Ct
- 7750 Tuscan Sun Ct
- 7738 Tuscan Sun Ct
- 7732 Clear Amber Place
- Cheyenne Plan at Aspen Meadows - Townhomes
- Midland Plan at Aspen Meadows - Townhomes
- 6818 Red Cardinal Loop
- 7964 Hardwood Cir
- 7970 Hardwood Cir
- 7958 Hardwood Cir
- 7952 Hardwood Cir
- 6794 Red Cardinal Loop
- 6824 Red Cardinal Loop
- 6817 Red Cardinal Loop
- 7946 Hardwood Cir
- 6788 Red Cardinal Loop
- 7976 Hardwood Cir
- 6830 Red Cardinal Loop
- 7940 Hardwood Cir
- 6782 Red Cardinal Loop Unit 8
- 6782 Red Cardinal Loop
- 7982 Hardwood Cir
- 7991 Superior Hill Place
- 6836 Red Cardinal Loop
- 7990 Martinwood Place
- 7974 Martinwood Place