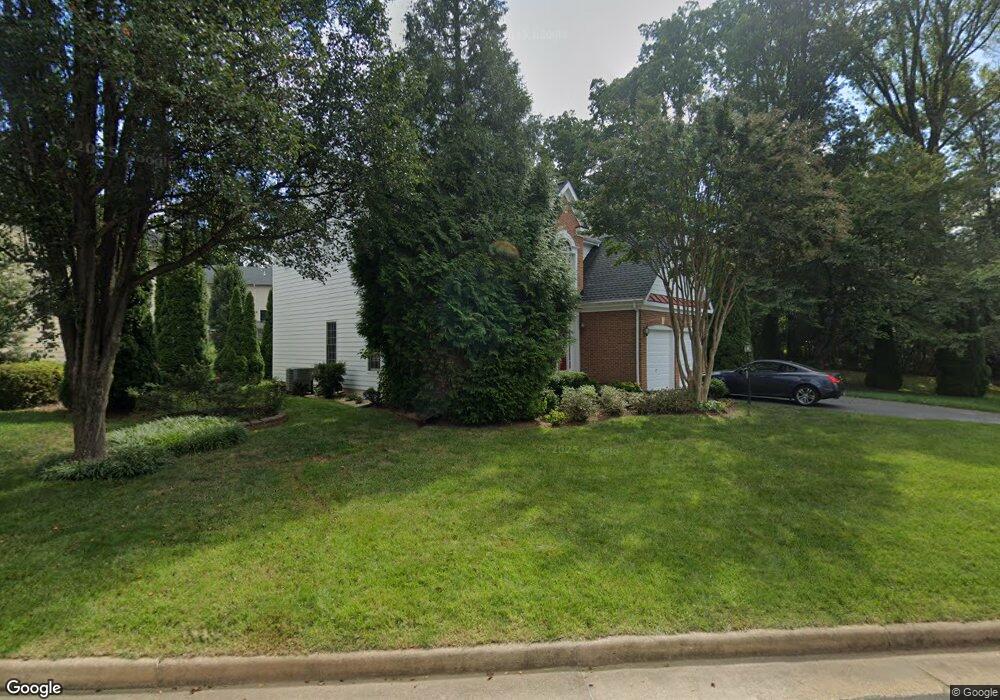
6813 Moly Dr Falls Church, VA 22046
Estimated Value: $1,544,000 - $1,842,000
4
Beds
5
Baths
3,383
Sq Ft
$487/Sq Ft
Est. Value
About This Home
This home is located at 6813 Moly Dr, Falls Church, VA 22046 and is currently estimated at $1,646,215, approximately $486 per square foot. 6813 Moly Dr is a home located in Fairfax County with nearby schools including Haycock Elementary School, Longfellow Middle School, and St. James Catholic School.
Ownership History
Date
Name
Owned For
Owner Type
Purchase Details
Closed on
Oct 17, 2006
Sold by
Shen Tom P
Bought by
Shen Pao-Ching and Kuang,Xiu F
Current Estimated Value
Home Financials for this Owner
Home Financials are based on the most recent Mortgage that was taken out on this home.
Original Mortgage
$880,000
Outstanding Balance
$525,984
Interest Rate
6.49%
Mortgage Type
New Conventional
Estimated Equity
$1,120,231
Create a Home Valuation Report for This Property
The Home Valuation Report is an in-depth analysis detailing your home's value as well as a comparison with similar homes in the area
Home Values in the Area
Average Home Value in this Area
Purchase History
| Date | Buyer | Sale Price | Title Company |
|---|---|---|---|
| Shen Pao-Ching | $1,100,000 | -- |
Source: Public Records
Mortgage History
| Date | Status | Borrower | Loan Amount |
|---|---|---|---|
| Open | Shen Pao-Ching | $880,000 |
Source: Public Records
Tax History Compared to Growth
Tax History
| Year | Tax Paid | Tax Assessment Tax Assessment Total Assessment is a certain percentage of the fair market value that is determined by local assessors to be the total taxable value of land and additions on the property. | Land | Improvement |
|---|---|---|---|---|
| 2025 | $15,038 | $1,380,030 | $596,000 | $784,030 |
| 2024 | $15,038 | $1,272,770 | $491,000 | $781,770 |
| 2023 | $13,492 | $1,171,680 | $436,000 | $735,680 |
| 2022 | $13,305 | $1,140,610 | $436,000 | $704,610 |
| 2021 | $13,758 | $1,149,820 | $394,000 | $755,820 |
| 2020 | $13,776 | $1,141,820 | $386,000 | $755,820 |
| 2019 | $12,601 | $1,044,410 | $351,000 | $693,410 |
| 2018 | $11,156 | $970,120 | $351,000 | $619,120 |
| 2017 | $11,307 | $954,980 | $348,000 | $606,980 |
| 2016 | $11,661 | $986,930 | $348,000 | $638,930 |
| 2015 | $10,533 | $924,760 | $322,000 | $602,760 |
| 2014 | $8,719 | $767,210 | $285,000 | $482,210 |
Source: Public Records
Map
Nearby Homes
- 6712 Moly Dr
- 2202 Grayson Place
- 2240 Highland Terrace
- 6927 Haycock Rd
- 6707 Hallwood Ave
- 6703 Hallwood Ave
- 6990 Falls Reach Dr Unit 313
- 6940 Spruce St
- 2118 Greenwich St
- 6956 Birch St
- 6616 Fisher Ave
- 2300 Meridian St
- 6613 Fisher Ave
- 1200 Offutt Dr
- 2221 Orchid Dr
- 156 Haycock Rd Unit A6
- 134 Birch St Unit A4
- 6601 Gordon Ave
- 255 W Falls Station Blvd Unit 704
- 255 W Falls Station Blvd Unit PH3
- 6811 Moly Dr
- 2224 Great Falls St
- 6812 Moly Dr
- 6805 Moly Dr
- 6806 Moly Dr
- 6816 Moly Dr
- 2226 Great Falls St
- 6820 Moly Dr
- 6804 Moly Dr
- 2232 Great Falls St
- 6822 Moly Dr
- 6802 Moly Dr
- 2231 Westwood Place
- 2216 Great Falls St
- 2234 Great Falls St
- 2221 Great Falls St
- 2223 Great Falls St
- 2242 Casemont Dr
- 2232 Westwood Place
- 2214 Great Falls St