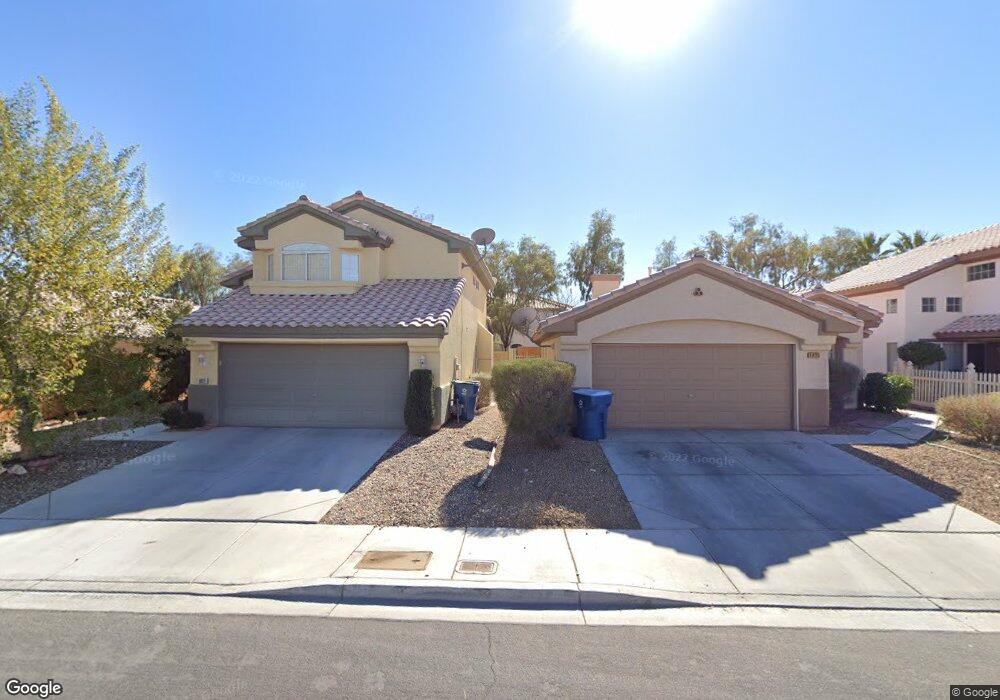
6813 Squaw Mnt Dr Unit 101 Las Vegas, NV 89130
Estimated Value: $234,000 - $281,000
2
Beds
2
Baths
1,197
Sq Ft
$219/Sq Ft
Est. Value
About This Home
This home is located at 6813 Squaw Mnt Dr Unit 101, Las Vegas, NV 89130 and is currently estimated at $262,517, approximately $219 per square foot. 6813 Squaw Mnt Dr Unit 101 is a home located in Clark County with nearby schools including Ernest May Elementary School, Theron L Swainston Middle School, and Shadow Ridge High School.
Ownership History
Date
Name
Owned For
Owner Type
Purchase Details
Closed on
Oct 19, 2010
Sold by
U S Bank National Association
Bought by
Bno West Llc
Current Estimated Value
Purchase Details
Closed on
May 13, 2010
Sold by
Ernst Thomas M
Bought by
U S Bank National Association
Purchase Details
Closed on
Aug 16, 2004
Sold by
Ernst Thomas M
Bought by
Ernst Thomas M
Home Financials for this Owner
Home Financials are based on the most recent Mortgage that was taken out on this home.
Original Mortgage
$125,500
Interest Rate
5.97%
Mortgage Type
VA
Purchase Details
Closed on
Mar 4, 1997
Sold by
Ernst Sharalyn
Bought by
Ernst Thomas M
Home Financials for this Owner
Home Financials are based on the most recent Mortgage that was taken out on this home.
Original Mortgage
$93,686
Interest Rate
7.9%
Mortgage Type
VA
Create a Home Valuation Report for This Property
The Home Valuation Report is an in-depth analysis detailing your home's value as well as a comparison with similar homes in the area
Home Values in the Area
Average Home Value in this Area
Purchase History
| Date | Buyer | Sale Price | Title Company |
|---|---|---|---|
| Bno West Llc | $57,900 | Ticor Title Las Vegas | |
| U S Bank National Association | $51,256 | Accommodation | |
| Ernst Thomas M | -- | Ticor Title Of Nevada Inc | |
| Ernst Thomas M | -- | Nevada Title Company | |
| Ernst Thomas M | $94,000 | Nevada Title Company |
Source: Public Records
Mortgage History
| Date | Status | Borrower | Loan Amount |
|---|---|---|---|
| Previous Owner | Ernst Thomas M | $125,500 | |
| Previous Owner | Ernst Thomas M | $93,686 |
Source: Public Records
Tax History Compared to Growth
Tax History
| Year | Tax Paid | Tax Assessment Tax Assessment Total Assessment is a certain percentage of the fair market value that is determined by local assessors to be the total taxable value of land and additions on the property. | Land | Improvement |
|---|---|---|---|---|
| 2025 | $1,057 | $58,627 | $21,700 | $36,927 |
| 2024 | $980 | $58,627 | $21,700 | $36,927 |
| 2023 | $980 | $60,042 | $25,900 | $34,142 |
| 2022 | $907 | $50,216 | $18,550 | $31,666 |
| 2021 | $840 | $48,402 | $17,850 | $30,552 |
| 2020 | $777 | $46,815 | $16,800 | $30,015 |
| 2019 | $729 | $44,941 | $15,050 | $29,891 |
| 2018 | $695 | $37,925 | $8,750 | $29,175 |
| 2017 | $1,207 | $36,820 | $7,000 | $29,820 |
| 2016 | $652 | $27,558 | $5,250 | $22,308 |
| 2015 | $650 | $21,856 | $3,850 | $18,006 |
| 2014 | $629 | $18,626 | $5,250 | $13,376 |
Source: Public Records
Map
Nearby Homes
- 6705 Squaw Mountain Dr Unit 102
- 6808 Indian Chief Dr Unit 204
- 6904 Indian Chief Dr Unit 201
- 6701 Squaw Mountain Dr Unit 201
- 6704 Indian Chief Dr Unit 101
- 5116 Jordan Frey St Unit 201
- 28460 U S Route 95
- 6513 Echo Crest Ave
- 5409 Flora Spray St
- 5144 Forest Oaks Dr
- 5024 Saint Annes Dr
- 5152 Forest Oaks Dr
- 5009 Forest Oaks Dr
- 5041 Portraits Place
- 6540 W Hammer Ln
- 6613 Sand Bench Ave
- 7208 Painted Shadows Way
- 5512 Goldbrush St
- 6507 Dove Point Place
- 6458 Secret Grove Ave
- 6813 Squaw Mnt Dr Unit 102
- 6813 Squaw Mnt Dr Unit 202
- 6813 Squaw Mnt Dr Unit 203
- 6813 Squaw Mnt Dr Unit 204
- 6813 Squaw Mnt Dr Unit 201
- 6901 Squaw Mountain Dr Unit 101
- 6901 Squaw Mnt Dr Unit 201
- 6901 Squaw Mnt Dr Unit 102
- 6901 Squaw Mnt Dr Unit 101
- 6901 Squaw Mnt Dr Unit 202
- 6901 Squaw Mnt Dr Unit 203
- 6901 Squaw Mnt Dr Unit 204
- 6901 Squaw Mountain Dr Unit 202
- 6901 Squaw Mountain Dr Unit 102
- 6805 Squaw Mnt Dr Unit 101
- 6805 Squaw Mnt Dr Unit 203
- 6805 Squaw Mnt Dr Unit 202
- 6805 Squaw Mnt Dr Unit 102
- 6805 Squaw Mnt Dr Unit 201
- 6805 Squaw Mnt Dr Unit 204