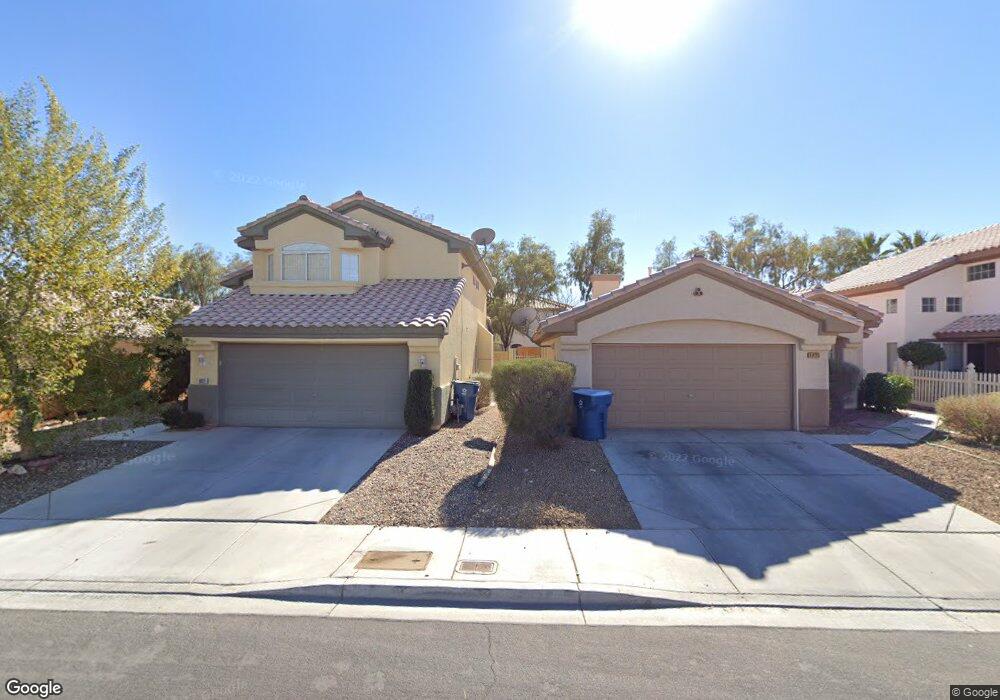
6813 Squaw Mnt Dr Unit 201 Las Vegas, NV 89130
Estimated Value: $259,000 - $280,000
2
Beds
2
Baths
1,189
Sq Ft
$225/Sq Ft
Est. Value
About This Home
This home is located at 6813 Squaw Mnt Dr Unit 201, Las Vegas, NV 89130 and is currently estimated at $267,159, approximately $224 per square foot. 6813 Squaw Mnt Dr Unit 201 is a home located in Clark County with nearby schools including Ernest May Elementary School, Theron L Swainston Middle School, and Shadow Ridge High School.
Ownership History
Date
Name
Owned For
Owner Type
Purchase Details
Closed on
Oct 3, 2020
Sold by
Gkc Trading Llc
Bought by
Suss Robin and Goldenthal Hava
Current Estimated Value
Purchase Details
Closed on
May 17, 2012
Sold by
The Bank Of New York Mellon
Bought by
Gkc Trading Llc
Purchase Details
Closed on
Jan 6, 2012
Sold by
Russell Chadd
Bought by
The Bank Of New York Mellon and The Bank Of New York
Purchase Details
Closed on
Sep 16, 2004
Sold by
Hurley Amy
Bought by
Russell Chadd
Home Financials for this Owner
Home Financials are based on the most recent Mortgage that was taken out on this home.
Original Mortgage
$179,000
Interest Rate
5.8%
Mortgage Type
Unknown
Purchase Details
Closed on
Mar 21, 1997
Sold by
Pueblo Llc
Bought by
Hurley Amy
Home Financials for this Owner
Home Financials are based on the most recent Mortgage that was taken out on this home.
Original Mortgage
$87,100
Interest Rate
7.63%
Mortgage Type
FHA
Create a Home Valuation Report for This Property
The Home Valuation Report is an in-depth analysis detailing your home's value as well as a comparison with similar homes in the area
Home Values in the Area
Average Home Value in this Area
Purchase History
| Date | Buyer | Sale Price | Title Company |
|---|---|---|---|
| Suss Robin | $162,500 | Lawyers Title Henderson | |
| Gkc Trading Llc | $56,000 | Lsi Title Agency Inc | |
| The Bank Of New York Mellon | $50,000 | Accommodation | |
| Russell Chadd | $179,000 | First American Title Co Of | |
| Hurley Amy | $90,000 | Nevada Title Company |
Source: Public Records
Mortgage History
| Date | Status | Borrower | Loan Amount |
|---|---|---|---|
| Previous Owner | Russell Chadd | $179,000 | |
| Previous Owner | Hurley Amy | $87,100 |
Source: Public Records
Tax History Compared to Growth
Tax History
| Year | Tax Paid | Tax Assessment Tax Assessment Total Assessment is a certain percentage of the fair market value that is determined by local assessors to be the total taxable value of land and additions on the property. | Land | Improvement |
|---|---|---|---|---|
| 2025 | $1,054 | $58,476 | $21,700 | $36,776 |
| 2024 | $976 | $58,476 | $21,700 | $36,776 |
| 2023 | $976 | $59,903 | $25,900 | $34,003 |
| 2022 | $904 | $50,089 | $18,550 | $31,539 |
| 2021 | $838 | $48,277 | $17,850 | $30,427 |
| 2020 | $775 | $46,693 | $16,800 | $29,893 |
| 2019 | $726 | $44,823 | $15,050 | $29,773 |
| 2018 | $693 | $37,810 | $8,750 | $29,060 |
| 2017 | $1,203 | $36,696 | $7,000 | $29,696 |
| 2016 | $650 | $27,468 | $5,250 | $22,218 |
| 2015 | $647 | $21,785 | $3,850 | $17,935 |
| 2014 | $627 | $18,562 | $5,250 | $13,312 |
Source: Public Records
Map
Nearby Homes
- 6705 Squaw Mountain Dr Unit 102
- 6808 Indian Chief Dr Unit 204
- 6904 Indian Chief Dr Unit 201
- 6701 Squaw Mountain Dr Unit 201
- 6704 Indian Chief Dr Unit 101
- 5116 Jordan Frey St Unit 201
- 28460 U S Route 95
- 6513 Echo Crest Ave
- 5409 Flora Spray St
- 5144 Forest Oaks Dr
- 5024 Saint Annes Dr
- 5152 Forest Oaks Dr
- 5009 Forest Oaks Dr
- 5041 Portraits Place
- 6540 W Hammer Ln
- 6613 Sand Bench Ave
- 7208 Painted Shadows Way
- 5512 Goldbrush St
- 6507 Dove Point Place
- 6458 Secret Grove Ave
- 6813 Squaw Mnt Dr Unit 102
- 6813 Squaw Mnt Dr Unit 202
- 6813 Squaw Mnt Dr Unit 203
- 6813 Squaw Mnt Dr Unit 204
- 6813 Squaw Mnt Dr Unit 101
- 6901 Squaw Mountain Dr Unit 101
- 6901 Squaw Mnt Dr Unit 201
- 6901 Squaw Mnt Dr Unit 102
- 6901 Squaw Mnt Dr Unit 101
- 6901 Squaw Mnt Dr Unit 202
- 6901 Squaw Mnt Dr Unit 203
- 6901 Squaw Mnt Dr Unit 204
- 6901 Squaw Mountain Dr Unit 202
- 6901 Squaw Mountain Dr Unit 102
- 6805 Squaw Mnt Dr Unit 101
- 6805 Squaw Mnt Dr Unit 203
- 6805 Squaw Mnt Dr Unit 202
- 6805 Squaw Mnt Dr Unit 102
- 6805 Squaw Mnt Dr Unit 201
- 6805 Squaw Mnt Dr Unit 204