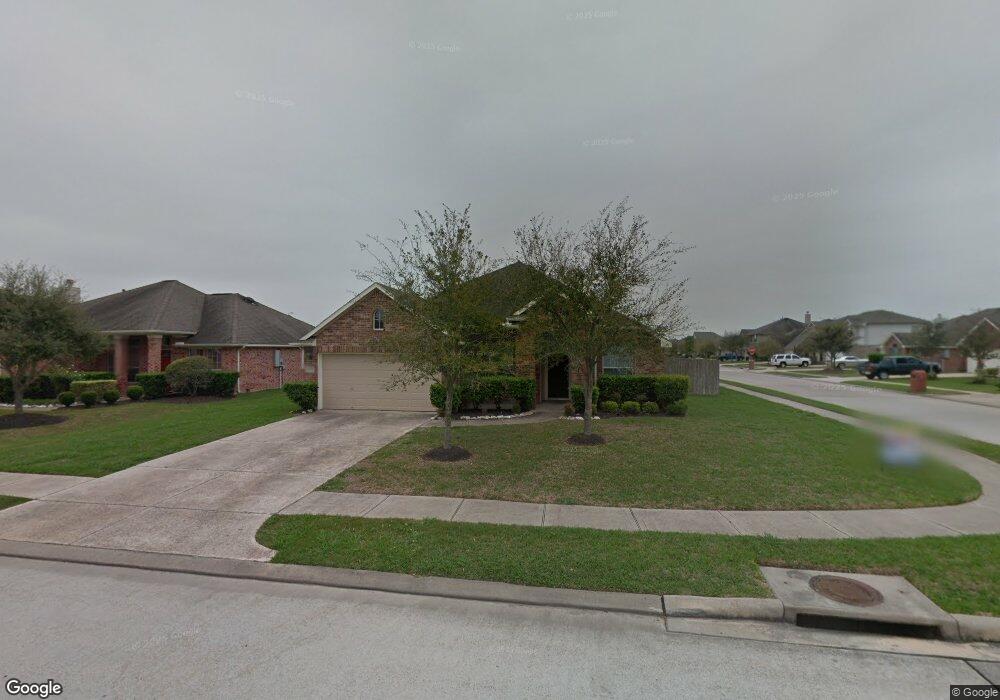
6814 Blake Ct Pearland, TX 77584
Estimated Value: $322,000 - $358,000
4
Beds
2
Baths
2,401
Sq Ft
$143/Sq Ft
Est. Value
About This Home
This home is located at 6814 Blake Ct, Pearland, TX 77584 and is currently estimated at $342,463, approximately $142 per square foot. 6814 Blake Ct is a home located in Brazoria County with nearby schools including H.C. Carleston Elementary School, Sam Jamison Middle School, and Pearland Junior High School South.
Ownership History
Date
Name
Owned For
Owner Type
Purchase Details
Closed on
Jan 18, 2019
Sold by
Nguyen Charles Q
Bought by
Nguyen Demi Phuong
Current Estimated Value
Purchase Details
Closed on
Dec 19, 2013
Sold by
Nguyen Charles Q
Bought by
Nguyen Demi Phuong and Nguyen Charles Q
Purchase Details
Closed on
Nov 15, 2011
Sold by
Anil Gokhan
Bought by
Nguyen Charles Q
Home Financials for this Owner
Home Financials are based on the most recent Mortgage that was taken out on this home.
Original Mortgage
$80,000
Outstanding Balance
$8,076
Interest Rate
3.99%
Mortgage Type
New Conventional
Estimated Equity
$334,387
Purchase Details
Closed on
Nov 10, 2011
Sold by
Anil Selcen
Bought by
Anil Gokhan
Home Financials for this Owner
Home Financials are based on the most recent Mortgage that was taken out on this home.
Original Mortgage
$80,000
Outstanding Balance
$8,076
Interest Rate
3.99%
Mortgage Type
New Conventional
Estimated Equity
$334,387
Create a Home Valuation Report for This Property
The Home Valuation Report is an in-depth analysis detailing your home's value as well as a comparison with similar homes in the area
Home Values in the Area
Average Home Value in this Area
Purchase History
| Date | Buyer | Sale Price | Title Company |
|---|---|---|---|
| Nguyen Demi Phuong | -- | None Available | |
| Nguyen Demi Phuong | -- | None Available | |
| Nguyen Charles Q | -- | Startex Title Company | |
| Anil Gokhan | -- | Startex Title Company |
Source: Public Records
Mortgage History
| Date | Status | Borrower | Loan Amount |
|---|---|---|---|
| Open | Nguyen Charles Q | $80,000 |
Source: Public Records
Tax History Compared to Growth
Tax History
| Year | Tax Paid | Tax Assessment Tax Assessment Total Assessment is a certain percentage of the fair market value that is determined by local assessors to be the total taxable value of land and additions on the property. | Land | Improvement |
|---|---|---|---|---|
| 2025 | $5,384 | $300,800 | $31,900 | $268,900 |
| 2023 | $5,384 | $283,939 | $31,900 | $303,100 |
| 2022 | $6,790 | $258,126 | $31,900 | $245,010 |
| 2021 | $6,680 | $234,660 | $28,710 | $205,950 |
| 2020 | $7,012 | $234,660 | $28,710 | $205,950 |
| 2019 | $3,453 | $114,780 | $13,290 | $101,490 |
| 2018 | $2,877 | $96,010 | $13,290 | $82,720 |
| 2017 | $2,982 | $97,750 | $13,290 | $84,460 |
| 2016 | $3,017 | $98,900 | $13,290 | $85,610 |
| 2014 | $2,908 | $89,400 | $13,290 | $76,110 |
Source: Public Records
Map
Nearby Homes
- 6806 Adella Ct
- 7333 Fite Rd
- 9.6 AC Fite Rd
- 3304 Autumn Forest Dr
- 2811 Afton Dr
- 3506 Windmill Palm Dr
- 2802 Afton Dr
- 3114 Autumn Ct
- 6816 Broadway St
- 6204 Raintree Dr
- 3402 Windmill Palm Dr
- 1 Farm To Market 1128
- 6108 Jordan Dr
- 7123 Elgin St
- 2526 Oak Rd
- 0 W Broadway St
- 2534 Oak Rd
- 6407 Hillock Ln
- 3237 Harkey Rd
- 3510 Dorsey Ln
- 6812 Blake Ct
- 6815 Adella Ct
- 6810 Blake Ct
- 6813 Adella Ct
- 3110 Keithwood Dr
- 3108 Keithwood Dr
- 6815 Blake Ct
- 3112 Keithwood Dr
- 6811 Adella Ct
- 6813 Blake Ct
- 6808 Blake Ct
- 3106 Keithwood Dr
- 3114 Keithwood Dr
- 6811 Blake Ct
- 6809 Adella Ct
- 3104 Keithwood Dr
- 3116 Keithwood Dr
- 6806 Blake Ct
- 6809 Blake Ct
- 6807 Adella Ct