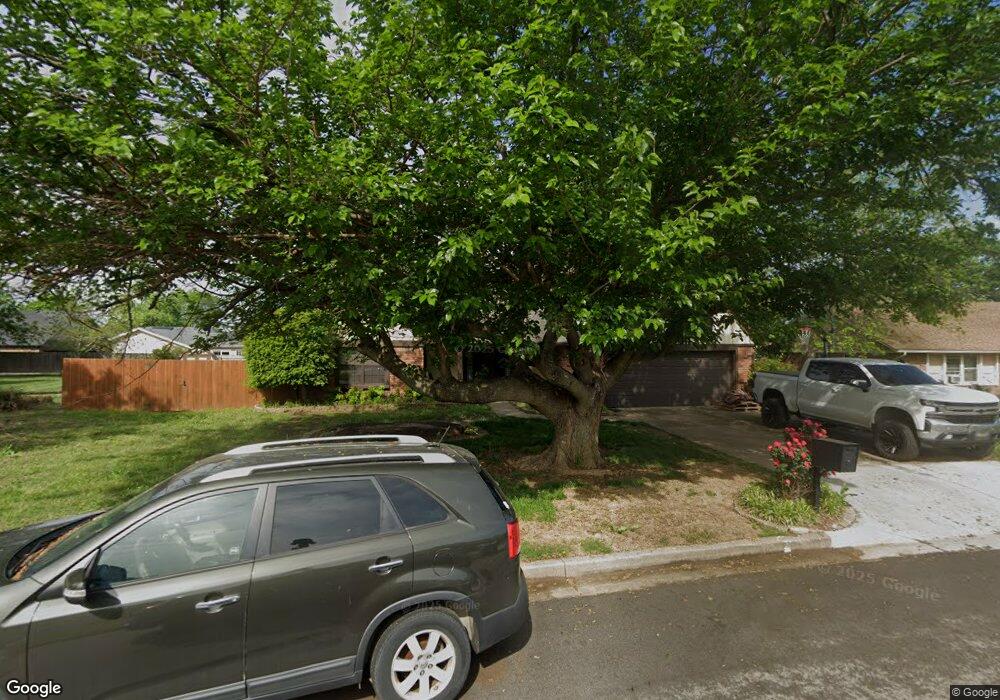
6814 S 29th Ave W Tulsa, OK 74132
West Highlands-Tulsa Hills NeighborhoodEstimated Value: $298,000 - $346,000
Studio
3
Baths
2,453
Sq Ft
$132/Sq Ft
Est. Value
About This Home
This home is located at 6814 S 29th Ave W, Tulsa, OK 74132 and is currently estimated at $323,421, approximately $131 per square foot. 6814 S 29th Ave W is a home located in Tulsa County with nearby schools including Jenks Middle School, Jenks West Intermediate Elementary School, and Jenks High School.
Ownership History
Date
Name
Owned For
Owner Type
Purchase Details
Closed on
Jun 3, 2024
Sold by
Fisher Terry Jay Scott and Fisher Julie Frances
Bought by
Rivers Tyler and Wixon Kassandre
Current Estimated Value
Home Financials for this Owner
Home Financials are based on the most recent Mortgage that was taken out on this home.
Original Mortgage
$306,348
Outstanding Balance
$301,686
Interest Rate
7.1%
Mortgage Type
FHA
Estimated Equity
$21,735
Purchase Details
Closed on
Jul 15, 2003
Sold by
Landamerica Onestop Inc
Bought by
Fisher Terry Jay Scott and Fisher Julie Frances
Purchase Details
Closed on
Jul 11, 2003
Sold by
Mckelphin Levi S and Mckelphin Emma L
Bought by
Landamerica Onestop Inc
Purchase Details
Closed on
May 24, 1999
Sold by
Purinton Robert J and Purington Janet E
Bought by
Mckelphin Levi S and Mckelphin Emma L
Purchase Details
Closed on
Jun 1, 1980
Create a Home Valuation Report for This Property
The Home Valuation Report is an in-depth analysis detailing your home's value as well as a comparison with similar homes in the area
Home Values in the Area
Average Home Value in this Area
Purchase History
| Date | Buyer | Sale Price | Title Company |
|---|---|---|---|
| Rivers Tyler | $312,000 | First American Title Insurance | |
| Fisher Terry Jay Scott | $135,000 | -- | |
| Landamerica Onestop Inc | $135,000 | -- | |
| Mckelphin Levi S | $139,500 | -- | |
| -- | $87,000 | -- |
Source: Public Records
Mortgage History
| Date | Status | Borrower | Loan Amount |
|---|---|---|---|
| Open | Rivers Tyler | $306,348 |
Source: Public Records
Tax History
| Year | Tax Paid | Tax Assessment Tax Assessment Total Assessment is a certain percentage of the fair market value that is determined by local assessors to be the total taxable value of land and additions on the property. | Land | Improvement |
|---|---|---|---|---|
| 2025 | $4,440 | $31,405 | $3,403 | $28,002 |
| 2024 | $2,584 | $20,022 | $2,110 | $17,912 |
| 2023 | $2,584 | $20,410 | $2,387 | $18,023 |
| 2022 | $2,583 | $18,815 | $3,069 | $15,746 |
| 2021 | $2,539 | $18,238 | $2,975 | $15,263 |
| 2020 | $2,409 | $17,677 | $2,883 | $14,794 |
| 2019 | $2,414 | $17,133 | $2,794 | $14,339 |
| 2018 | $2,338 | $16,605 | $2,708 | $13,897 |
| 2017 | $2,212 | $17,093 | $2,788 | $14,305 |
| 2016 | $2,152 | $16,595 | $2,806 | $13,789 |
| 2015 | $2,125 | $16,982 | $2,871 | $14,111 |
| 2014 | $2,053 | $15,642 | $2,871 | $12,771 |
Source: Public Records
Map
Nearby Homes
- 6513 S 29th West Place
- 3302 Aspen Ridge
- 3306 W 68th St
- 7215 S 26th West Ave
- 2510 W 66th Place
- 6461 S 28th West Ave
- 2921 W 64th St
- 2125 W 73rd St
- 6655 Riva Ridge Rd
- 7637 S 26th West Ave
- 6101 S 33rd West Ave
- 3474 W 75th St S
- 6033 S 31st West Ave
- 3290 W 71st St S
- 0 W 71st St S
- 7785 Forest Ln
- 3576 W 77th St S
- 3130 W 58th St
- 2102 W 58th St
- 3404 Redbud Ln
- 6814 S 29th West Ave
- 6808 S 29th West Ave
- 6820 S 29th West Ave
- 6849 S 30th West Ave
- 6843 S 30th Ave W
- 6855 S 30th West Ave
- 6809 S 29th West Ave
- 6815 S 29th West Ave
- 6815 S 29th Ave W
- 6837 S 30th West Ave
- 6861 S 30th West Ave
- 6828 S 29th West Ave
- 6804 S 29th West Ave
- 2804 W 68th St
- 6825 S 29th West Ave
- 6833 S 30th West Ave
- 6901 S 30th West Ave
- 6804 S 28th West Ave
- 6902 S 29th West Ave
- 6844 S 30th West Ave
Your Personal Tour Guide
Ask me questions while you tour the home.