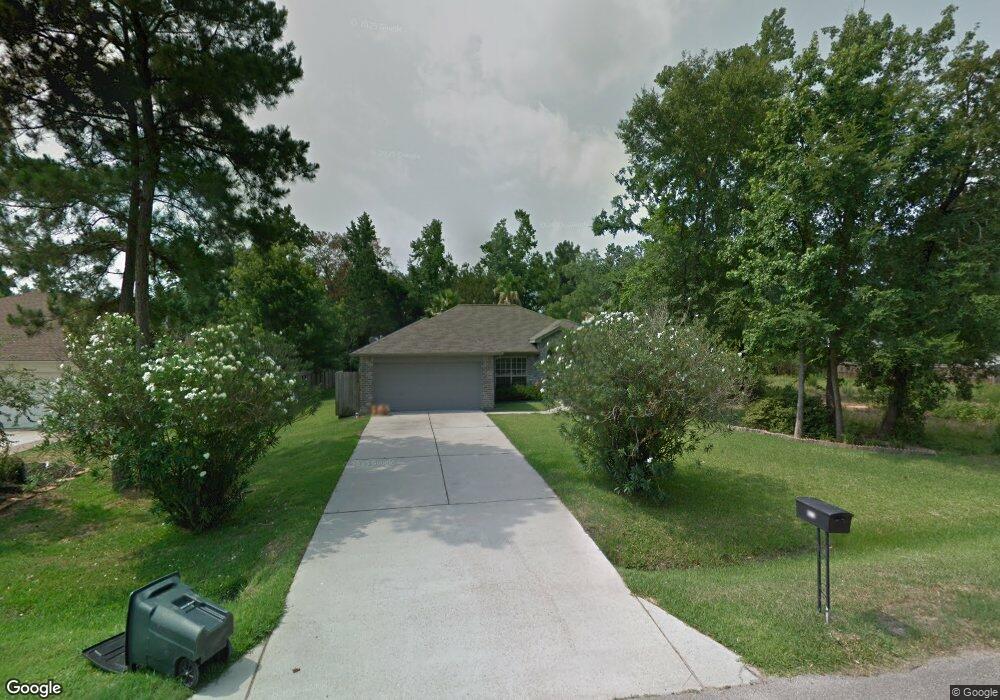
6815 Durango Dr Magnolia, TX 77354
Estimated Value: $286,000 - $299,534
3
Beds
2
Baths
1,743
Sq Ft
$168/Sq Ft
Est. Value
About This Home
This home is located at 6815 Durango Dr, Magnolia, TX 77354 and is currently estimated at $293,134, approximately $168 per square foot. 6815 Durango Dr is a home located in Montgomery County with nearby schools including Tom R. Ellisor Elementary School, Bear Branch Junior High School, and Magnolia High School.
Ownership History
Date
Name
Owned For
Owner Type
Purchase Details
Closed on
Oct 29, 2010
Sold by
Nix Mark A and Nix Penny A
Bought by
Kelly Robert C and Kelly Catherine A
Current Estimated Value
Home Financials for this Owner
Home Financials are based on the most recent Mortgage that was taken out on this home.
Original Mortgage
$124,000
Outstanding Balance
$82,395
Interest Rate
4.41%
Mortgage Type
New Conventional
Estimated Equity
$210,739
Purchase Details
Closed on
Jan 27, 2000
Sold by
Royce Homes Lp
Bought by
Nix Mark A and Turnwald Penny A
Home Financials for this Owner
Home Financials are based on the most recent Mortgage that was taken out on this home.
Original Mortgage
$95,600
Interest Rate
7.86%
Purchase Details
Closed on
Jun 15, 1999
Sold by
Stoecker Corp
Bought by
Royce Homes Lp
Purchase Details
Closed on
Jun 1, 1998
Sold by
Chow Candido
Bought by
Stoecker Corp
Purchase Details
Closed on
May 1, 1989
Bought by
Kelly Robert C and Kelly Catherine A
Create a Home Valuation Report for This Property
The Home Valuation Report is an in-depth analysis detailing your home's value as well as a comparison with similar homes in the area
Home Values in the Area
Average Home Value in this Area
Purchase History
| Date | Buyer | Sale Price | Title Company |
|---|---|---|---|
| Kelly Robert C | -- | Stewart Title Houston Div | |
| Nix Mark A | -- | Stewart Title | |
| Royce Homes Lp | -- | Stewart Title | |
| Stoecker Corp | -- | -- | |
| Kelly Robert C | -- | -- |
Source: Public Records
Mortgage History
| Date | Status | Borrower | Loan Amount |
|---|---|---|---|
| Open | Kelly Robert C | $124,000 | |
| Previous Owner | Nix Mark A | $95,600 |
Source: Public Records
Tax History Compared to Growth
Tax History
| Year | Tax Paid | Tax Assessment Tax Assessment Total Assessment is a certain percentage of the fair market value that is determined by local assessors to be the total taxable value of land and additions on the property. | Land | Improvement |
|---|---|---|---|---|
| 2025 | $750 | $260,043 | $58,000 | $202,043 |
| 2024 | $727 | $269,748 | $58,000 | $211,748 |
| 2023 | $727 | $250,560 | $58,000 | $229,050 |
| 2022 | $4,019 | $227,780 | $45,900 | $215,010 |
| 2021 | $3,849 | $207,070 | $42,500 | $164,570 |
| 2020 | $4,085 | $201,880 | $36,000 | $165,880 |
| 2019 | $3,861 | $191,740 | $36,000 | $156,510 |
| 2018 | $2,450 | $174,310 | $12,360 | $161,950 |
| 2017 | $3,696 | $174,310 | $12,360 | $161,950 |
| 2016 | $3,627 | $171,050 | $12,360 | $158,690 |
| 2015 | $2,054 | $161,910 | $12,360 | $149,550 |
| 2014 | $2,054 | $149,350 | $12,360 | $137,330 |
Source: Public Records
Map
Nearby Homes
- 6818 Woodland Oaks
- 6902 Woodland Oaks
- 7010 Durango Dr
- 6910 Woodland Oaks
- 6906 Grant Dr
- 7002 Durango Creek Dr
- 7119 Durango Dr
- 723 Hinsdale
- 6846 Durango Creek Dr
- 7455 Durango Creek Dr
- 7022 Dillon Dr
- 6626 Grant Dr
- 7203 Cool Springs Ct
- 6718 Durango Creek Dr
- 6706 Durango Creek Dr
- 7215 Autumn Day Ct
- 33127 Cottonwood Bend
- 906 Wiley Dr
- 247 Brazen Forest Trail
- 222 Brazen Forest Trail
- 6811 Durango Dr
- 6819 Durango Dr
- 6823 Durango Dr
- 6807 Durango Dr
- 6822 Woodland Oaks
- 6806 Woodland Oaks
- 6903 Durango Dr
- 6803 Durango Dr
- 6814 Durango Dr
- 6810 Durango Dr
- 6802 Woodland Oaks
- 6907 Durango Dr
- 6723 Durango Dr
- 6902 Durango Dr
- 6802 Durango Dr
- 6906 Woodland Oaks
- 6722 Woodland Oaks
- 6906 Durango Dr
- 6722 Durango Dr
- 6911 Durango Dr