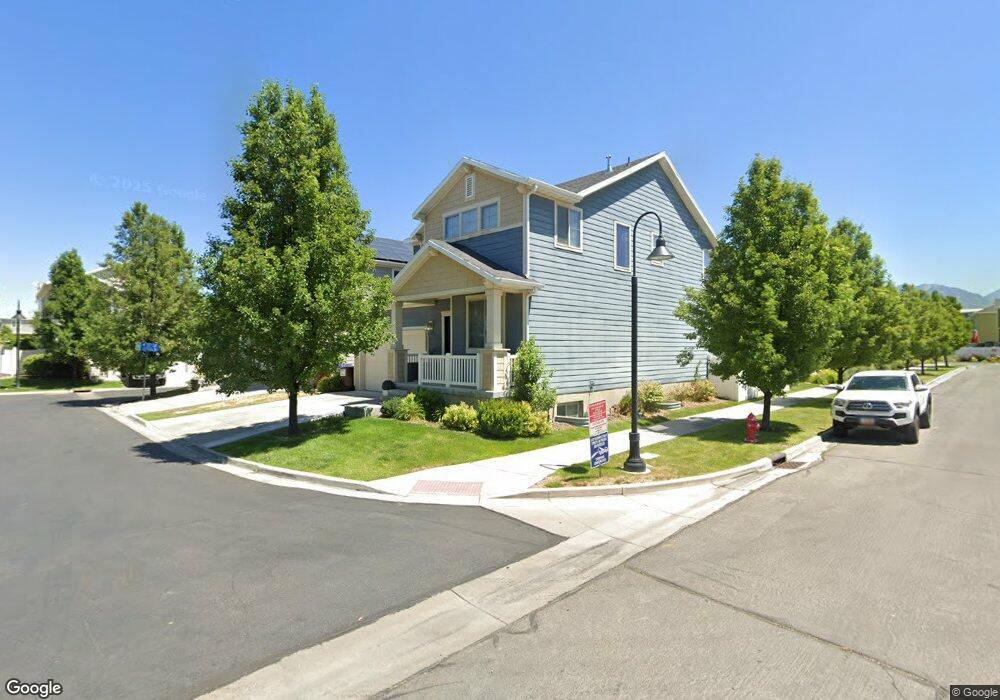
6815 S Snickers Ln Unit 313 Midvale, UT 84047
Estimated Value: $647,000 - $694,914
4
Beds
3
Baths
3,206
Sq Ft
$211/Sq Ft
Est. Value
About This Home
This home is located at 6815 S Snickers Ln Unit 313, Midvale, UT 84047 and is currently estimated at $675,479, approximately $210 per square foot. 6815 S Snickers Ln Unit 313 is a home located in Salt Lake County with nearby schools including East Midvale Elementary School, Midvale Middle School, and Hillcrest High School.
Ownership History
Date
Name
Owned For
Owner Type
Purchase Details
Closed on
Aug 21, 2020
Sold by
Anderson Rod N and Anderson Shauna
Bought by
Roskiewich Sandra Ann
Current Estimated Value
Home Financials for this Owner
Home Financials are based on the most recent Mortgage that was taken out on this home.
Original Mortgage
$375,920
Outstanding Balance
$333,467
Interest Rate
3%
Mortgage Type
New Conventional
Estimated Equity
$342,012
Purchase Details
Closed on
Jul 1, 2015
Sold by
Mcnamara David B and Mcnamara Lauren
Bought by
Mcnamara David B
Purchase Details
Closed on
Oct 14, 2014
Sold by
Alpine Homes Llc
Bought by
Andreason Rod N and Andreason Shauna
Home Financials for this Owner
Home Financials are based on the most recent Mortgage that was taken out on this home.
Original Mortgage
$264,512
Interest Rate
4.08%
Mortgage Type
New Conventional
Create a Home Valuation Report for This Property
The Home Valuation Report is an in-depth analysis detailing your home's value as well as a comparison with similar homes in the area
Home Values in the Area
Average Home Value in this Area
Purchase History
| Date | Buyer | Sale Price | Title Company |
|---|---|---|---|
| Roskiewich Sandra Ann | -- | Investors Title Ins Agency | |
| Mcnamara David B | -- | None Available | |
| Andreason Rod N | -- | First American Title |
Source: Public Records
Mortgage History
| Date | Status | Borrower | Loan Amount |
|---|---|---|---|
| Open | Roskiewich Sandra Ann | $375,920 | |
| Previous Owner | Andreason Rod N | $264,512 |
Source: Public Records
Tax History
| Year | Tax Paid | Tax Assessment Tax Assessment Total Assessment is a certain percentage of the fair market value that is determined by local assessors to be the total taxable value of land and additions on the property. | Land | Improvement |
|---|---|---|---|---|
| 2025 | $3,787 | $658,800 | $86,400 | $572,400 |
| 2024 | $3,787 | $645,900 | $81,900 | $564,000 |
| 2023 | $3,628 | $614,600 | $65,000 | $549,600 |
| 2022 | $3,826 | $632,800 | $63,700 | $569,100 |
| 2021 | $3,390 | $481,100 | $56,400 | $424,700 |
| 2020 | $3,019 | $406,000 | $48,300 | $357,700 |
| 2019 | $3,049 | $400,200 | $48,300 | $351,900 |
| 2017 | $2,761 | $354,600 | $40,300 | $314,300 |
| 2016 | $2,501 | $311,800 | $40,300 | $271,500 |
Source: Public Records
Map
Nearby Homes
- 847 W Presidio Dr
- 6891 S Suzanne Dr
- 6907 S Zandi Dr
- 1019 Village River Ln Unit A6
- 6487 S 1140 W
- 6414 S 1090 W
- 6440 S 1190 W Unit 200
- 1143 W Hollow View Way
- 7110 S 1115 W
- 7151 S 1115 W
- 1253 W Borthwick Way
- 7257 S Rural Rd
- 6773 S 1300 W
- 234 Waterstone Cir Unit 9
- 7107 S 1245 W
- 578 7th Ave
- 228 Waterstone Cir Unit 10
- 576 7th Ave
- 6556 S Jefferson St
- 6556 S Jefferson St Unit 15
- 6815 S Snickers Ln
- 6807 S Snickers Ln Unit 305
- 6807 S Snickers Ln Unit 314
- 842 W Cider Ct Unit 312
- 6816 S Snickers Ln Unit 316
- 6806 S Snickers Ln Unit 315
- 844 W Cider Ct Unit 311
- 861 W Presidio Dr
- 853 W Presidio Dr
- 854 W Cider Ct
- 862 W Cider Ct
- 862 W Cider Ct Unit 307
- 846 W Cider Ct Unit 310
- 846 W Cider Ct
- 872 W Snickers Ln Unit 306
- 872 W Snickers Ln
- 837 W Presidio Dr
- 848 W Cider Ct Unit 309
- 6809 S Altitude Ct
- 878 W Snickers Ln Unit 305
Your Personal Tour Guide
Ask me questions while you tour the home.