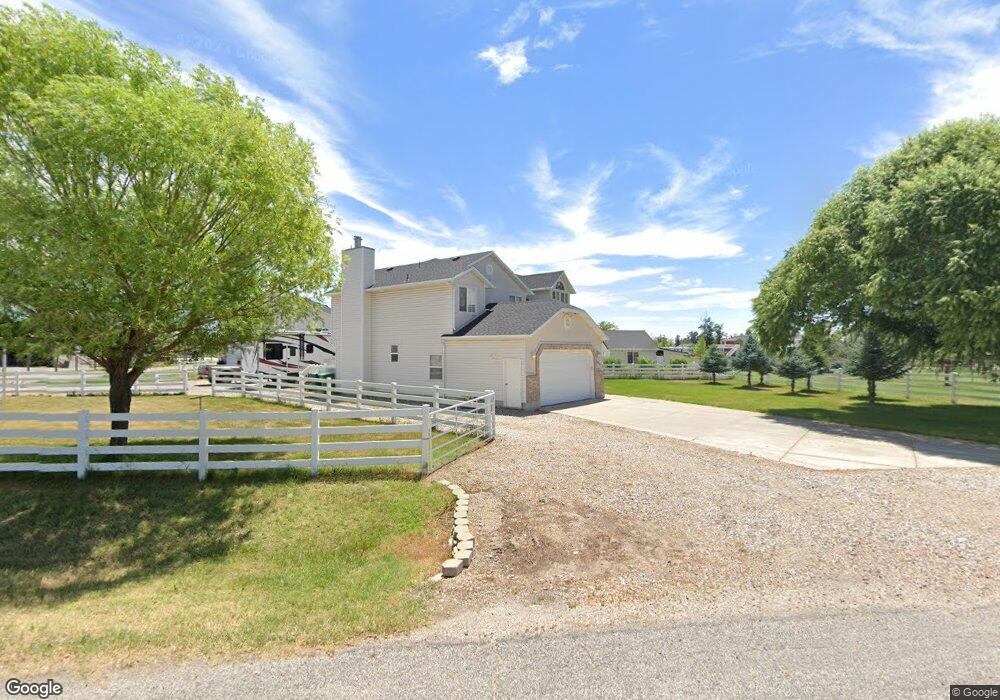
6817 W 5700 S Hooper, UT 84315
Estimated Value: $680,000 - $705,000
4
Beds
2
Baths
2,320
Sq Ft
$298/Sq Ft
Est. Value
About This Home
This home is located at 6817 W 5700 S, Hooper, UT 84315 and is currently estimated at $690,331, approximately $297 per square foot. 6817 W 5700 S is a home located in Weber County with nearby schools including Hooper Elementary School, Rocky Mountain Junior High School, and Fremont High School.
Ownership History
Date
Name
Owned For
Owner Type
Purchase Details
Closed on
Sep 29, 2010
Sold by
Aurora Loan Services Llc
Bought by
Federal National Mortgage Association
Current Estimated Value
Purchase Details
Closed on
Sep 27, 2010
Sold by
Conger Tony C
Bought by
Aurora Loan Services Llc
Purchase Details
Closed on
Dec 8, 1999
Sold by
Peters Theodore D and Peters Marijke P
Bought by
Hoel Andrew E and Hoel Elizabeth A
Home Financials for this Owner
Home Financials are based on the most recent Mortgage that was taken out on this home.
Original Mortgage
$153,850
Interest Rate
9.75%
Purchase Details
Closed on
Nov 15, 1996
Sold by
Davis Diann
Bought by
Peters Theodore D and Peters Marijke P
Create a Home Valuation Report for This Property
The Home Valuation Report is an in-depth analysis detailing your home's value as well as a comparison with similar homes in the area
Home Values in the Area
Average Home Value in this Area
Purchase History
| Date | Buyer | Sale Price | Title Company |
|---|---|---|---|
| Federal National Mortgage Association | -- | Accommodation | |
| Aurora Loan Services Llc | $263,678 | Security Title Insurance Age | |
| Hoel Andrew E | -- | -- | |
| Peters Theodore D | -- | -- |
Source: Public Records
Mortgage History
| Date | Status | Borrower | Loan Amount |
|---|---|---|---|
| Previous Owner | Hoel Andrew E | $153,850 |
Source: Public Records
Tax History Compared to Growth
Tax History
| Year | Tax Paid | Tax Assessment Tax Assessment Total Assessment is a certain percentage of the fair market value that is determined by local assessors to be the total taxable value of land and additions on the property. | Land | Improvement |
|---|---|---|---|---|
| 2025 | $3,342 | $613,663 | $178,782 | $434,881 |
| 2024 | $3,208 | $331,051 | $98,330 | $232,721 |
| 2023 | $3,140 | $320,095 | $97,852 | $222,243 |
| 2022 | $3,281 | $340,451 | $87,126 | $253,325 |
| 2021 | $2,481 | $433,082 | $138,352 | $294,730 |
| 2020 | $2,442 | $391,000 | $123,283 | $267,717 |
| 2019 | $2,455 | $372,001 | $124,086 | $247,915 |
| 2018 | $2,534 | $367,817 | $124,051 | $243,766 |
| 2017 | $2,470 | $347,999 | $89,292 | $258,707 |
| 2016 | $2,501 | $191,241 | $49,084 | $142,157 |
| 2015 | $2,188 | $165,298 | $29,911 | $135,387 |
| 2014 | $2,021 | $148,672 | $29,911 | $118,761 |
Source: Public Records
Map
Nearby Homes
- 5801 S 7100 W
- 5319 S 7100 W
- 6360 W 5500 S
- 5752 W 2425 N
- 0 W 5500 S
- 6014 W 5300 S
- 6036 W 4700 S
- 4100 S 5900 W
- 5335 W 5500 S
- 3729 S 5600 W Unit 6
- 3720 S 5600 W Unit 2
- 3719 S 5600 W Unit 7
- 2084 N 4500 W
- 3632 S 5400 W
- 4146 S 5800 W Unit 5
- 4163 S 5800 W Unit 2
- 2462 N Hooded Crane Ct
- 4879 S 5050 W
- 4302 W 1550 N
- 2444 N Hooded Crane Cir Unit 11
- 6839 W 5700 S
- 5757 S 6800 W
- 6783 W 5700 S
- 5681 S 6800 W
- 5754 S 6800 W
- 6772 W 5700 S
- 6753 W 5700 S
- 5659 S 6800 W
- 6924 W 5700 S
- 5660 S 6800 W
- 5714 S 6950 W
- 6737 W 5700 S
- 5760 S 6950 W
- 5767 S 6950 W Unit 8
- 5685 S 6700 W
- 5759 S 6950 W
- 5638 S 6800 W Unit 8
- 6715 W 5700 S
- 5784 S 6950 W
- 5784 S 6950 W Unit 20