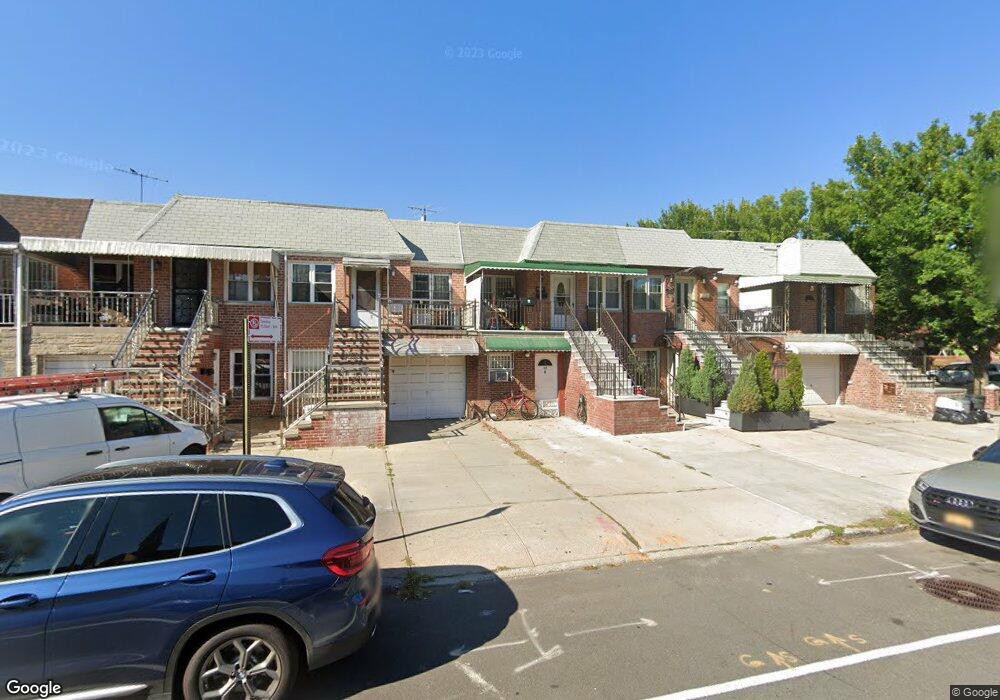
6819 31st Ave Woodside, NY 11377
Jackson Heights NeighborhoodEstimated Value: $1,042,000 - $1,151,000
--
Bed
--
Bath
1,544
Sq Ft
$721/Sq Ft
Est. Value
About This Home
This home is located at 6819 31st Ave, Woodside, NY 11377 and is currently estimated at $1,112,493, approximately $720 per square foot. 6819 31st Ave is a home located in Queens County with nearby schools including Ps 152 Gwendolyn N Alleyne School, I.S. 010 Horace Greeley, and William Cullen Bryant High School.
Ownership History
Date
Name
Owned For
Owner Type
Purchase Details
Closed on
Jul 27, 2024
Sold by
Carrasco Juan
Bought by
Carrasco Alejandro and Carrasco Diana
Current Estimated Value
Purchase Details
Closed on
Oct 26, 2000
Sold by
Kim Young B
Bought by
Carrasco Juan
Home Financials for this Owner
Home Financials are based on the most recent Mortgage that was taken out on this home.
Original Mortgage
$222,750
Outstanding Balance
$79,630
Interest Rate
7.83%
Estimated Equity
$1,032,863
Purchase Details
Closed on
Apr 26, 1999
Sold by
Kang Won Sun and Kang Won S
Bought by
Kim Young B
Home Financials for this Owner
Home Financials are based on the most recent Mortgage that was taken out on this home.
Original Mortgage
$198,000
Interest Rate
6.9%
Create a Home Valuation Report for This Property
The Home Valuation Report is an in-depth analysis detailing your home's value as well as a comparison with similar homes in the area
Home Values in the Area
Average Home Value in this Area
Purchase History
| Date | Buyer | Sale Price | Title Company |
|---|---|---|---|
| Carrasco Alejandro | -- | -- | |
| Carrasco Alejandro | -- | -- | |
| Carrasco Juan | $297,000 | -- | |
| Carrasco Juan | $297,000 | -- | |
| Kim Young B | $220,000 | -- | |
| Kim Young B | $220,000 | -- |
Source: Public Records
Mortgage History
| Date | Status | Borrower | Loan Amount |
|---|---|---|---|
| Open | Carrasco Juan | $222,750 | |
| Closed | Carrasco Juan | $222,750 | |
| Previous Owner | Kim Young B | $198,000 | |
| Closed | Carrasco Juan | $29,700 |
Source: Public Records
Tax History Compared to Growth
Tax History
| Year | Tax Paid | Tax Assessment Tax Assessment Total Assessment is a certain percentage of the fair market value that is determined by local assessors to be the total taxable value of land and additions on the property. | Land | Improvement |
|---|---|---|---|---|
| 2025 | $8,221 | $43,387 | $6,781 | $36,606 |
| 2024 | $8,221 | $40,932 | $6,867 | $34,065 |
| 2023 | $7,756 | $38,616 | $6,768 | $31,848 |
| 2022 | $7,709 | $55,020 | $9,180 | $45,840 |
| 2021 | $8,065 | $48,780 | $9,180 | $39,600 |
| 2020 | $7,653 | $50,700 | $9,180 | $41,520 |
| 2019 | $7,135 | $50,820 | $9,180 | $41,640 |
| 2018 | $6,560 | $32,180 | $7,305 | $24,875 |
| 2017 | $6,560 | $32,180 | $7,359 | $24,821 |
| 2016 | $6,385 | $32,180 | $7,359 | $24,821 |
| 2015 | $3,662 | $30,130 | $8,508 | $21,622 |
| 2014 | $3,662 | $28,425 | $9,626 | $18,799 |
Source: Public Records
Map
Nearby Homes
- 69-20 31st Ave
- 3134 68th St
- 31-39 68th St
- 72-01 31st Ave
- 3005 72nd St
- 32-31 71st St
- 25-45 72nd St
- 3241 71st St
- 2524 72nd St
- 32-32 60th St
- 2502 73rd St
- 51-40 30th Ave Unit 4H
- 56-05 31st Ave Unit 2O
- 5607 31st Ave Unit 1B
- 56-02 31st Ave Unit 2A
- 32-24 75th St
- 55-23 31st Ave Unit 4H
- 51-28 30th Ave Unit 6A
- 51-28 30th Ave Unit 3
- 33-42 70th St
- 6821 31st Ave
- 6817 31st Ave
- 6821 31st Ave
- 6821 31st Ave Unit 1st
- 68-21 31st Ave Unit 1
- 68-21 31st Ave Unit 1st
- 68-21 31st Ave
- 6823 31st Ave Unit 2Fl
- 6823 31st Ave
- 6823 31st Ave Unit 2Fl
- 6815 31st Ave
- 6823 31st Ave
- 68-11 31st Ave
- 3052 69th St
- 6811 31st Ave
- 3050 69th St
- 6809 31st Ave
- 6807 31st Ave
- 6807 31st Ave
- 3048 69th St Unit ground floor