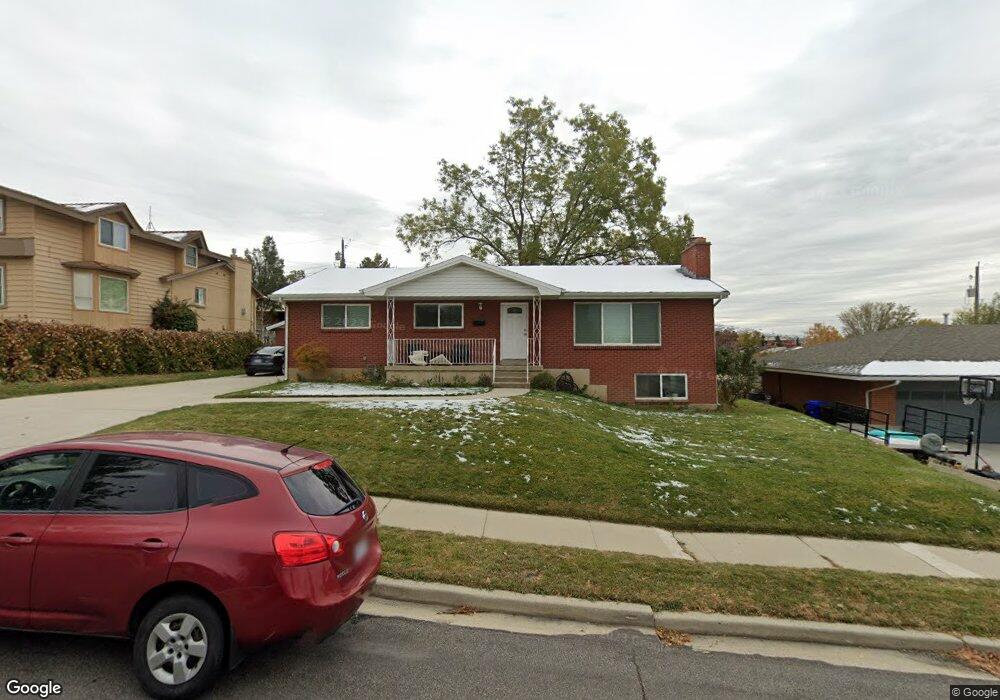
682 E 100 N Bountiful, UT 84010
Estimated Value: $584,000 - $720,000
5
Beds
3
Baths
2,900
Sq Ft
$215/Sq Ft
Est. Value
About This Home
This home is located at 682 E 100 N, Bountiful, UT 84010 and is currently estimated at $622,328, approximately $214 per square foot. 682 E 100 N is a home located in Davis County with nearby schools including Holbrook Elementary School, Bountiful Junior High School, and Bountiful High School.
Ownership History
Date
Name
Owned For
Owner Type
Purchase Details
Closed on
Jun 23, 2021
Sold by
Call Ball Phyllis and Lyman Ball Val
Bought by
Ball
Current Estimated Value
Home Financials for this Owner
Home Financials are based on the most recent Mortgage that was taken out on this home.
Original Mortgage
$494,700
Outstanding Balance
$447,889
Interest Rate
2.9%
Mortgage Type
New Conventional
Estimated Equity
$174,439
Purchase Details
Closed on
Jun 22, 2021
Sold by
Ball Kevin Val and V & P Ball Family Trust
Bought by
Lewis Matthew David and Best Abigail Alyssa
Home Financials for this Owner
Home Financials are based on the most recent Mortgage that was taken out on this home.
Original Mortgage
$494,700
Outstanding Balance
$447,889
Interest Rate
2.9%
Mortgage Type
New Conventional
Estimated Equity
$174,439
Purchase Details
Closed on
Apr 17, 2007
Sold by
Ball Val Lyman and Ball Phyllis Call
Bought by
Ball Val L and Ball Phyllis C
Create a Home Valuation Report for This Property
The Home Valuation Report is an in-depth analysis detailing your home's value as well as a comparison with similar homes in the area
Purchase History
| Date | Buyer | Sale Price | Title Company |
|---|---|---|---|
| Ball | -- | -- | |
| Lewis Matthew David | -- | Metro Natl Title Ass | |
| Ball Val L | -- | None Available |
Source: Public Records
Mortgage History
| Date | Status | Borrower | Loan Amount |
|---|---|---|---|
| Open | Lewis Matthew David | $494,700 |
Source: Public Records
Tax History
| Year | Tax Paid | Tax Assessment Tax Assessment Total Assessment is a certain percentage of the fair market value that is determined by local assessors to be the total taxable value of land and additions on the property. | Land | Improvement |
|---|---|---|---|---|
| 2025 | $3,287 | $298,100 | $136,971 | $161,129 |
| 2024 | $3,248 | $306,350 | $126,239 | $180,111 |
| 2023 | $3,115 | $533,000 | $229,526 | $303,474 |
| 2022 | $3,193 | $311,850 | $122,308 | $189,542 |
| 2021 | $2,613 | $373,000 | $181,839 | $191,161 |
| 2020 | $2,315 | $331,000 | $165,561 | $165,439 |
| 2019 | $2,373 | $332,000 | $161,686 | $170,314 |
| 2018 | $2,204 | $303,000 | $150,387 | $152,613 |
| 2016 | $1,976 | $147,565 | $48,286 | $99,279 |
| 2015 | $1,959 | $138,215 | $48,286 | $89,929 |
| 2014 | $1,825 | $131,949 | $48,286 | $83,663 |
| 2013 | -- | $125,121 | $56,870 | $68,251 |
Source: Public Records
Map
Nearby Homes
- 683 E 100 N
- 129 N 800 E
- 6 N 800 E
- 513 N 400 E Unit 14B
- 453 N 400 E Unit 7-D
- 456 E 500 S
- 520 S Orchard Dr Unit 17
- 255 E 400 S
- 1138 Briggs Dr
- 275 E Peach Ln S
- 323 Peach Ln
- 357 S 100 E
- 49 E 200 N Unit 4
- 41 E 200 N Unit 6
- 55 E 200 N Unit 2
- 51 E 200 N Unit 3
- 254 N Main St
- 256 N Main St
- 252 N Main St
- 17 E 400 N Unit 19B
Your Personal Tour Guide
Ask me questions while you tour the home.