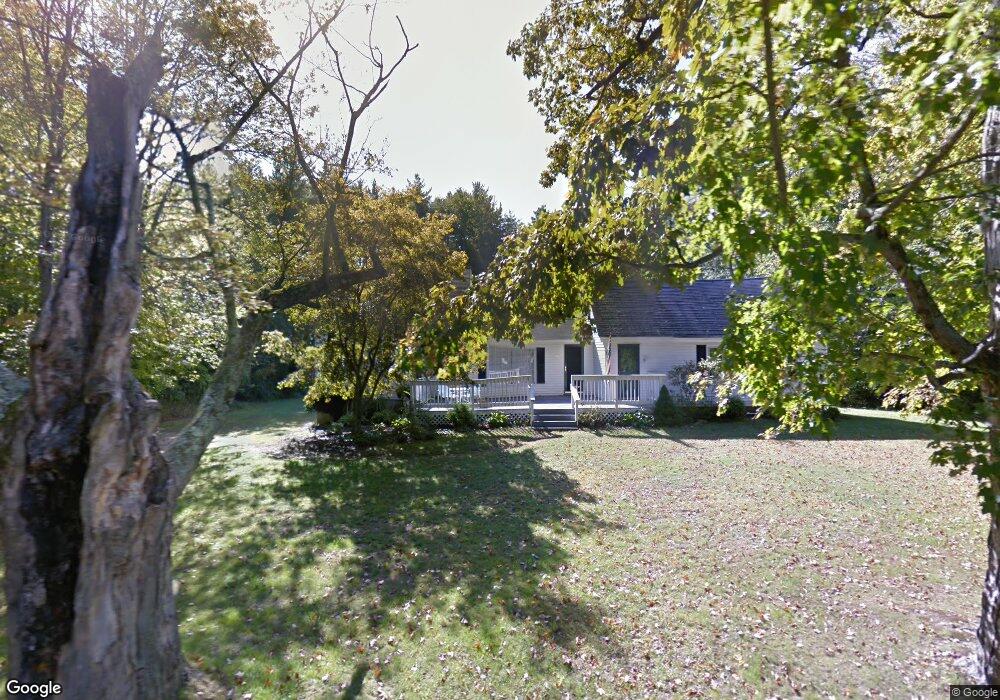
682 River Rd Eliot, ME 03903
South Eliot NeighborhoodEstimated Value: $536,629 - $644,000
4
Beds
2
Baths
2,139
Sq Ft
$286/Sq Ft
Est. Value
About This Home
This home is located at 682 River Rd, Eliot, ME 03903 and is currently estimated at $611,407, approximately $285 per square foot. 682 River Rd is a home located in York County with nearby schools including Marshwood High School and Seacoast Waldorf School.
Ownership History
Date
Name
Owned For
Owner Type
Purchase Details
Closed on
Feb 5, 2020
Sold by
Anthony Deborah J and Anthony Deborah
Bought by
Gilmore Bonnie and Gilmore David
Current Estimated Value
Home Financials for this Owner
Home Financials are based on the most recent Mortgage that was taken out on this home.
Original Mortgage
$271,062
Outstanding Balance
$240,642
Interest Rate
3.74%
Mortgage Type
FHA
Estimated Equity
$370,765
Create a Home Valuation Report for This Property
The Home Valuation Report is an in-depth analysis detailing your home's value as well as a comparison with similar homes in the area
Home Values in the Area
Average Home Value in this Area
Purchase History
| Date | Buyer | Sale Price | Title Company |
|---|---|---|---|
| Gilmore Bonnie | -- | None Available |
Source: Public Records
Mortgage History
| Date | Status | Borrower | Loan Amount |
|---|---|---|---|
| Open | Gilmore Bonnie | $271,062 |
Source: Public Records
Tax History
| Year | Tax Paid | Tax Assessment Tax Assessment Total Assessment is a certain percentage of the fair market value that is determined by local assessors to be the total taxable value of land and additions on the property. | Land | Improvement |
|---|---|---|---|---|
| 2024 | $4,236 | $357,500 | $140,700 | $216,800 |
| 2023 | $4,077 | $332,800 | $134,300 | $198,500 |
| 2022 | $3,916 | $323,600 | $134,300 | $189,300 |
| 2021 | $4,344 | $321,800 | $123,600 | $198,200 |
| 2020 | $4,457 | $303,200 | $118,300 | $184,900 |
| 2019 | $3,960 | $269,400 | $118,300 | $151,100 |
| 2018 | $3,960 | $269,400 | $118,300 | $151,100 |
| 2017 | $3,852 | $269,400 | $118,300 | $151,100 |
| 2016 | $3,785 | $269,400 | $118,300 | $151,100 |
| 2015 | $3,772 | $269,400 | $118,300 | $151,100 |
| 2014 | $3,718 | $269,400 | $118,300 | $151,100 |
| 2013 | $3,548 | $269,400 | $118,300 | $151,100 |
Source: Public Records
Map
Nearby Homes
- 220 Dover Point Rd
- 25 Fosters Dr
- 11 Ayers Ln
- Slip B18 Little Bay
- 21 Clearwater Dr
- 25 Heritage Dr
- 18 Deborah Ln
- 41 Clearwater Dr
- 0 Cote Dr Unit 55B
- 65 Polly Ann Trailer Park
- 69 Polly Ann Trailer Park
- 348 Dover Point Rd
- 354 Dover Point Rd
- 6 Isaac Lucas Cir
- 116 Heron Cove Rd
- 16 Polly Ann Park
- 28 Little Bay Dr
- 33 Little Bay Dr
- 13 Little Bay Dr
- 18 Little Bay Dr
Your Personal Tour Guide
Ask me questions while you tour the home.