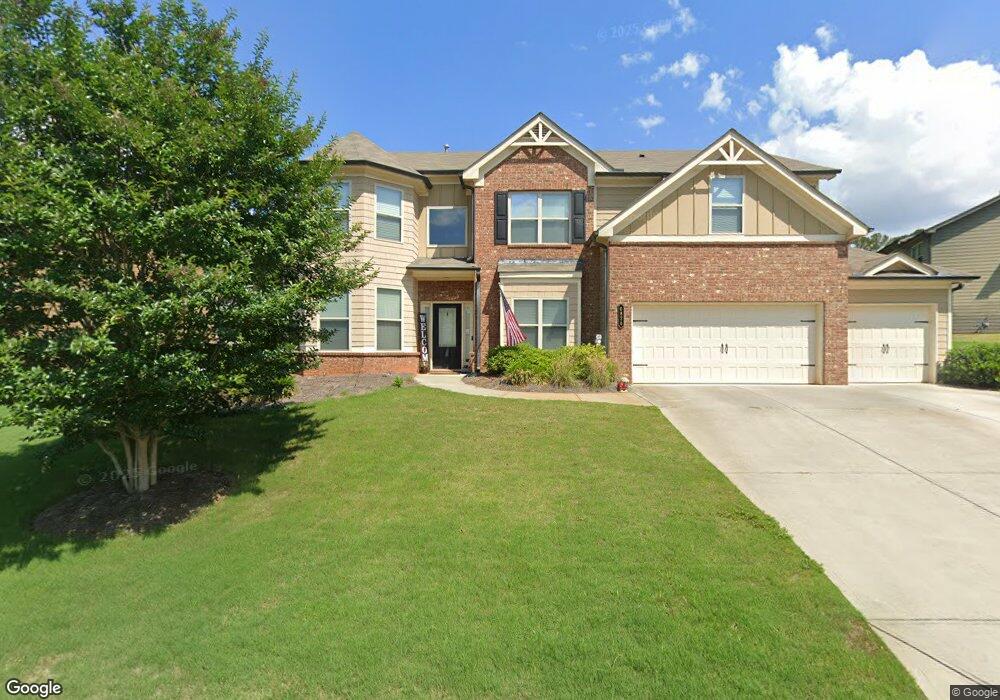
6820 Lacebark Dr Unit 27 Dawsonville, GA 30534
Estimated Value: $495,000 - $539,000
5
Beds
3
Baths
3,121
Sq Ft
$162/Sq Ft
Est. Value
About This Home
This home is located at 6820 Lacebark Dr Unit 27, Dawsonville, GA 30534 and is currently estimated at $507,012, approximately $162 per square foot. 6820 Lacebark Dr Unit 27 is a home with nearby schools including Silver City Elementary School, North Forsyth Middle School, and North Forsyth High School.
Ownership History
Date
Name
Owned For
Owner Type
Purchase Details
Closed on
May 13, 2022
Sold by
Shaufelberger Sherry Lynn and Shaufelberger Jason Charles
Bought by
Button Gary L and Button Cheryl L
Current Estimated Value
Purchase Details
Closed on
Sep 10, 2019
Sold by
Cerniglia Jon Paul
Bought by
Bostock Gregory C and Button Brittany M
Home Financials for this Owner
Home Financials are based on the most recent Mortgage that was taken out on this home.
Original Mortgage
$305,550
Interest Rate
3.6%
Mortgage Type
New Conventional
Purchase Details
Closed on
Aug 14, 2015
Sold by
Almont Homes Ne Inc
Bought by
Cerniglia Jon Paul
Home Financials for this Owner
Home Financials are based on the most recent Mortgage that was taken out on this home.
Original Mortgage
$246,050
Interest Rate
4.16%
Mortgage Type
Commercial
Create a Home Valuation Report for This Property
The Home Valuation Report is an in-depth analysis detailing your home's value as well as a comparison with similar homes in the area
Home Values in the Area
Average Home Value in this Area
Purchase History
| Date | Buyer | Sale Price | Title Company |
|---|---|---|---|
| Button Gary L | $570,000 | None Listed On Document | |
| Bostock Gregory C | $315,000 | -- | |
| Cerniglia Jon Paul | $259,000 | -- |
Source: Public Records
Mortgage History
| Date | Status | Borrower | Loan Amount |
|---|---|---|---|
| Previous Owner | Bostock Gregory C | $305,550 | |
| Previous Owner | Cerniglia Jon Paul | $246,050 |
Source: Public Records
Tax History Compared to Growth
Tax History
| Year | Tax Paid | Tax Assessment Tax Assessment Total Assessment is a certain percentage of the fair market value that is determined by local assessors to be the total taxable value of land and additions on the property. | Land | Improvement |
|---|---|---|---|---|
| 2025 | $4,713 | $195,876 | $54,000 | $141,876 |
| 2024 | $4,713 | $192,200 | $44,000 | $148,200 |
| 2023 | $5,130 | $208,400 | $32,000 | $176,400 |
| 2022 | $3,984 | $124,016 | $18,000 | $106,016 |
| 2021 | $3,425 | $124,016 | $18,000 | $106,016 |
| 2020 | $3,266 | $118,268 | $18,000 | $100,268 |
| 2019 | $3,424 | $123,800 | $18,000 | $105,800 |
| 2018 | $3,181 | $115,040 | $16,000 | $99,040 |
| 2017 | $2,793 | $100,632 | $16,000 | $84,632 |
| 2016 | $2,793 | $100,632 | $16,000 | $84,632 |
| 2015 | $445 | $16,000 | $16,000 | $0 |
Source: Public Records
Map
Nearby Homes
- 7185 Carruthers Way
- 7185 Carruthers Way Unit LOT 26
- 7215 Carruthers Way
- 7215 Carruthers Way Unit LOT 24
- 7195 Carruthers Way Unit LOT 25
- 7225 Carruthers Way Unit LOT 23
- 7225 Carruthers Way
- 7195 Carruthers Way
- 6890 Ellorie Dr
- 6890 Ellorie Dr Unit LOT 3
- 6910 Ellorie Dr
- 6910 Ellorie Dr Unit LOT 4
- 6920 Ellorie Dr
- 6920 Ellorie Dr Unit LOT 5
- Birch Plan at Ellorie Estates
- Hazel Plan at Ellorie Estates
- Sapling Plan at Ellorie Estates
- 244 Bryn Brooke Dr
- 7260 Waggamon Way Unit LOT 42
- 25 Haley Dr
- 6810 Lacebark Dr Unit 28
- 6810 Lacebark Dr
- 6710 Whitebark Dr
- 6910 Lacebark Dr Unit 26
- 6690 Whitebark Dr Unit 29
- 6920 Lacebark Dr Unit 25
- 6920 Lacebark Dr
- 6810 Whitebark Dr Unit 16
- 6810 Whitebark Dr
- 6915 Lacebark Dr Unit 21
- 6915 Lacebark Dr
- 6715 Whitebark Dr Unit 5
- 6715 Whitebark Dr
- 6680 Whitebark Dr
- 6680 Whitebark Dr Unit 30
- 6805 Whitebark Dr
- 6685 Whitebark Dr Unit 4
- 6685 Whitebark Dr
- 6930 Lacebark Dr Unit 24
- 6930 Lacebark Dr