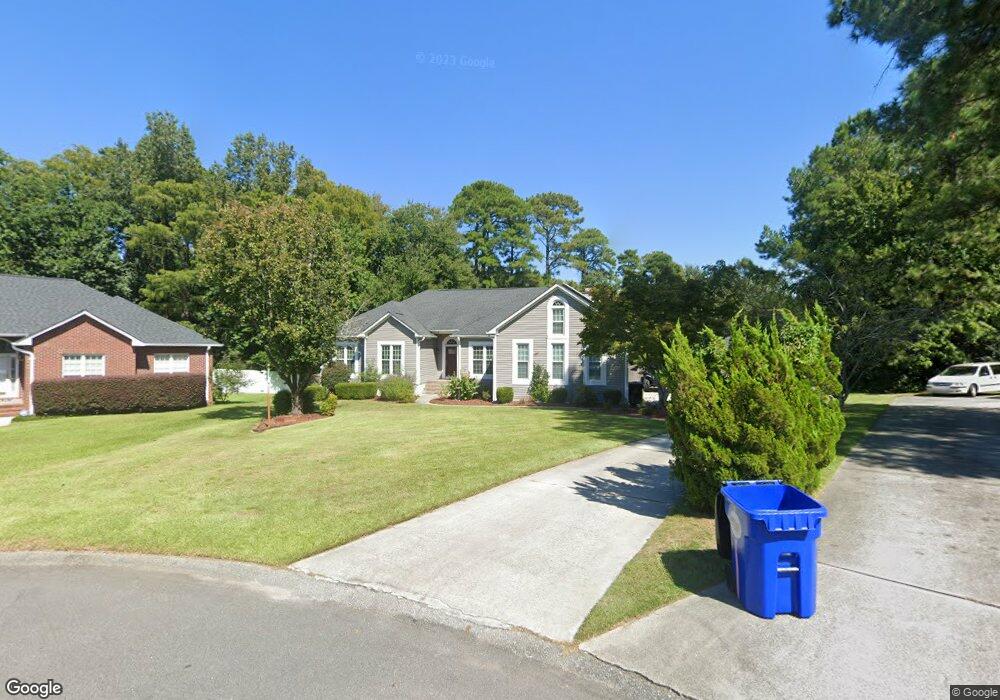
6821 Creek Ridge Rd Wilmington, NC 28411
Estimated Value: $541,000 - $571,000
4
Beds
4
Baths
2,752
Sq Ft
$201/Sq Ft
Est. Value
About This Home
This home is located at 6821 Creek Ridge Rd, Wilmington, NC 28411 and is currently estimated at $552,990, approximately $200 per square foot. 6821 Creek Ridge Rd is a home located in New Hanover County with nearby schools including Murrayville Elementary School, Emma B. Trask Middle School, and Emsley A. Laney High School.
Ownership History
Date
Name
Owned For
Owner Type
Purchase Details
Closed on
Feb 17, 2017
Sold by
Steigerwald James A and Steigerwald Patricia A
Bought by
Mares Gregory and Mares Karri Lynn
Current Estimated Value
Home Financials for this Owner
Home Financials are based on the most recent Mortgage that was taken out on this home.
Original Mortgage
$213,600
Outstanding Balance
$176,802
Interest Rate
4.19%
Mortgage Type
New Conventional
Estimated Equity
$376,188
Purchase Details
Closed on
Jul 31, 1997
Sold by
White Jeffery H Laura L
Bought by
Steigerwald J A Jr Patricia
Purchase Details
Closed on
Jul 20, 1993
Sold by
G & F Construction Inc
Bought by
White Jeffery H Laura L
Purchase Details
Closed on
Mar 4, 1993
Sold by
Coastal Carolina Devel Inc
Bought by
G & F Construction Inc
Purchase Details
Closed on
Jun 1, 1987
Bought by
Coastal Carolina Devel Inc
Create a Home Valuation Report for This Property
The Home Valuation Report is an in-depth analysis detailing your home's value as well as a comparison with similar homes in the area
Home Values in the Area
Average Home Value in this Area
Purchase History
| Date | Buyer | Sale Price | Title Company |
|---|---|---|---|
| Mares Gregory | $267,000 | Tiago Title Llc | |
| Steigerwald J A Jr Patricia | $200,000 | -- | |
| White Jeffery H Laura L | $177,000 | -- | |
| G & F Construction Inc | $41,500 | -- | |
| Coastal Carolina Devel Inc | -- | -- |
Source: Public Records
Mortgage History
| Date | Status | Borrower | Loan Amount |
|---|---|---|---|
| Open | Mares Gregory | $213,600 |
Source: Public Records
Tax History Compared to Growth
Tax History
| Year | Tax Paid | Tax Assessment Tax Assessment Total Assessment is a certain percentage of the fair market value that is determined by local assessors to be the total taxable value of land and additions on the property. | Land | Improvement |
|---|---|---|---|---|
| 2025 | -- | $570,300 | $124,400 | $445,900 |
| 2023 | -- | $371,700 | $88,100 | $283,600 |
| 2022 | $2,029 | $371,700 | $88,100 | $283,600 |
| 2021 | $2,047 | $371,700 | $88,100 | $283,600 |
| 2020 | $1,678 | $265,300 | $48,300 | $217,000 |
| 2019 | $1,678 | $265,300 | $48,300 | $217,000 |
| 2018 | $1,678 | $265,300 | $48,300 | $217,000 |
| 2017 | $1,718 | $265,300 | $48,300 | $217,000 |
| 2016 | $1,674 | $241,500 | $48,300 | $193,200 |
| 2015 | $1,555 | $241,500 | $48,300 | $193,200 |
| 2014 | $1,529 | $241,500 | $48,300 | $193,200 |
Source: Public Records
Map
Nearby Homes
- 1132 Potomac Ct
- 7542 Quail Woods Rd
- 6707 Creek Ridge Rd
- 6924 Aida Ct
- 6918 Haberdeen Dr
- 7319 Thurgood Rd
- 1303 Big Horn Ct
- 7012 Brittany Lakes Dr
- 6803 Murrayville Rd
- 2522 White Rd
- 802 Calico Crossing
- 7213 Thurgood Rd
- 6609 Murrayville Rd
- 6723 Newbury Way
- 2805 Valor Dr Unit 207
- 7204 Courtney Pines Rd
- 2824 White Rd
- 6404 Shire Ln
- 2431 White Rd
- 7024 Quail Woods Rd
- 6817 Creek Ridge Rd
- 6820 Creek Ridge Rd
- 1107 Sheffield Ct
- 1109 Sheffield Ct
- 1105 Sheffield Ct
- 6816 Creek Ridge Rd
- 6813 Creek Ridge Rd
- 1111 Sheffield Ct
- 1103 Sheffield Ct
- 6809 Creek Ridge Rd
- 1208 Potomac Ct
- 6808 Creek Ridge Rd
- 1212 Potomac Ct
- 1204 Potomac Ct
- 1112 Sheffield Ct
- 1108 Sheffield Dr
- 1216 Potomac Ct
- 1108 Sheffield Ct
- 1110 Sheffield Dr
- 1106 Sheffield Dr