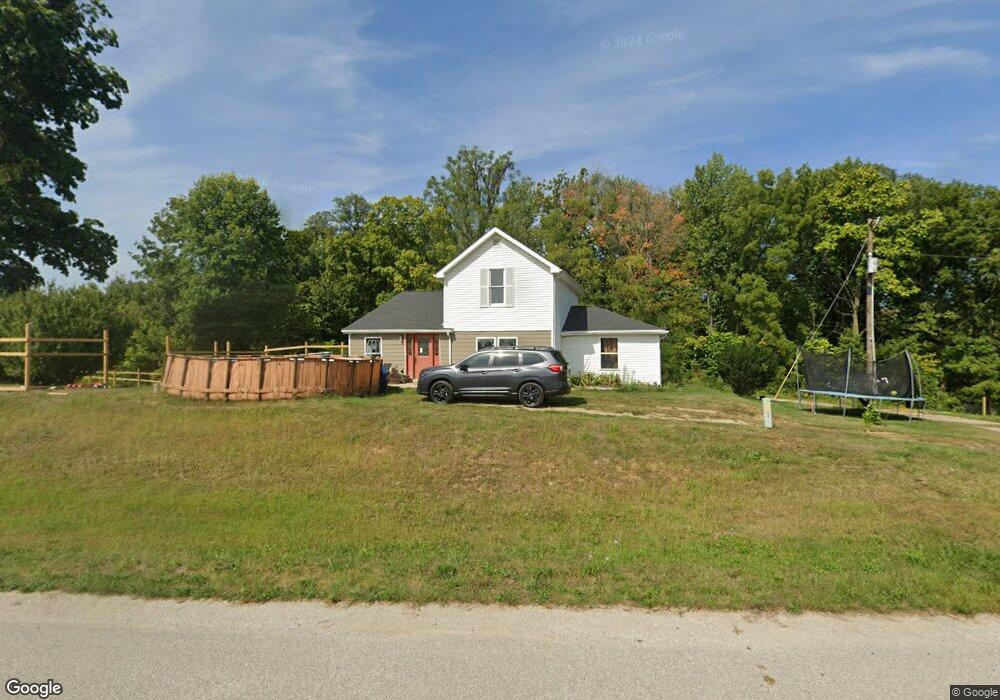
6822 N East Rockfield Rd Delphi, IN 46923
Estimated Value: $250,000 - $361,582
3
Beds
1
Bath
1,888
Sq Ft
$155/Sq Ft
Est. Value
About This Home
This home is located at 6822 N East Rockfield Rd, Delphi, IN 46923 and is currently estimated at $292,896, approximately $155 per square foot. 6822 N East Rockfield Rd is a home located in Carroll County with nearby schools including Delphi Community Elementary School, Delphi Community Middle School, and Delphi Community High School.
Ownership History
Date
Name
Owned For
Owner Type
Purchase Details
Closed on
Nov 19, 2019
Sold by
Hinkle Cody B
Bought by
Owens Andrew
Current Estimated Value
Home Financials for this Owner
Home Financials are based on the most recent Mortgage that was taken out on this home.
Original Mortgage
$174,080
Outstanding Balance
$152,839
Interest Rate
3.5%
Mortgage Type
VA
Estimated Equity
$140,057
Purchase Details
Closed on
Nov 22, 2017
Sold by
D & La Farms Llc
Bought by
Hinkle Cody B
Home Financials for this Owner
Home Financials are based on the most recent Mortgage that was taken out on this home.
Original Mortgage
$140,409
Interest Rate
4.37%
Mortgage Type
FHA
Purchase Details
Closed on
Jan 16, 2015
Sold by
Orr Mary V and Vandiver Karen
Bought by
D & La Farms Llc
Purchase Details
Closed on
Apr 23, 2010
Sold by
Orr Mary V and Carter Karen J
Bought by
State Of Indiana
Purchase Details
Closed on
Jun 8, 1998
Sold by
Lake William
Bought by
Vandiver Karen
Create a Home Valuation Report for This Property
The Home Valuation Report is an in-depth analysis detailing your home's value as well as a comparison with similar homes in the area
Home Values in the Area
Average Home Value in this Area
Purchase History
| Date | Buyer | Sale Price | Title Company |
|---|---|---|---|
| Owens Andrew | -- | Columbia Title Inc | |
| Hinkle Cody B | -- | None Available | |
| D & La Farms Llc | -- | None Available | |
| State Of Indiana | $29,360 | None Available | |
| State Of Indiana | -- | None Available | |
| Vandiver Karen | $94,000 | -- |
Source: Public Records
Mortgage History
| Date | Status | Borrower | Loan Amount |
|---|---|---|---|
| Open | Owens Andrew | $174,080 | |
| Previous Owner | Hinkle Cody B | $140,409 |
Source: Public Records
Tax History Compared to Growth
Tax History
| Year | Tax Paid | Tax Assessment Tax Assessment Total Assessment is a certain percentage of the fair market value that is determined by local assessors to be the total taxable value of land and additions on the property. | Land | Improvement |
|---|---|---|---|---|
| 2024 | $1,709 | $297,500 | $35,700 | $261,800 |
| 2023 | $1,061 | $216,400 | $35,700 | $180,700 |
| 2022 | $1,061 | $164,900 | $30,900 | $134,000 |
| 2021 | $912 | $143,800 | $30,900 | $112,900 |
| 2020 | $774 | $122,300 | $30,900 | $91,400 |
| 2019 | $713 | $120,100 | $30,900 | $89,200 |
| 2018 | $494 | $102,100 | $30,100 | $72,000 |
| 2017 | $110 | $39,500 | $19,500 | $20,000 |
| 2016 | $538 | $37,700 | $19,600 | $18,100 |
| 2014 | $851 | $58,100 | $20,900 | $37,200 |
Source: Public Records
Map
Nearby Homes
- 6518 N 285 W
- 6374 N 260 W
- 6365 Erie St
- 5122 W 700 N
- 350 N Lee St
- 330 E Main St
- 409 N Wilson St
- 112 Williston Ct
- 116 Williston Ct
- 2160 S Ridgeview Rd
- 625 N State 75 Rd
- 205 E Franklin St
- 7548 W Ridgeview Cir
- 317 N Market St
- 215 W Front St
- 228 W Vine St
- 230 W Vine St
- 232 W Vine St
- 1158 N Brewer Ave
- 4139 N 900 W
- 6822 N East Rockfield Rd
- 6968 N East Rockfield Rd
- 6645 NE Rockfield Rd
- 6576 W Rockfield Rd
- 6576 2nd St
- 2771 W 655 N
- 2783 W 655 N
- 6576 NE Rockfield Rd
- 6455 N 285 W
- 2782 W 655 N
- 6462 N 280 W
- 2784 W 640 N
- 7093 N East Rockfield Rd
- 6478 N Whistler Rd
- 2775 W 645 N
- 6440 N 280 W
- 6435 N 285 W
- 6464 N Whistler Rd
- 2909 W 640 N
- 6452 N Whistler Rd W