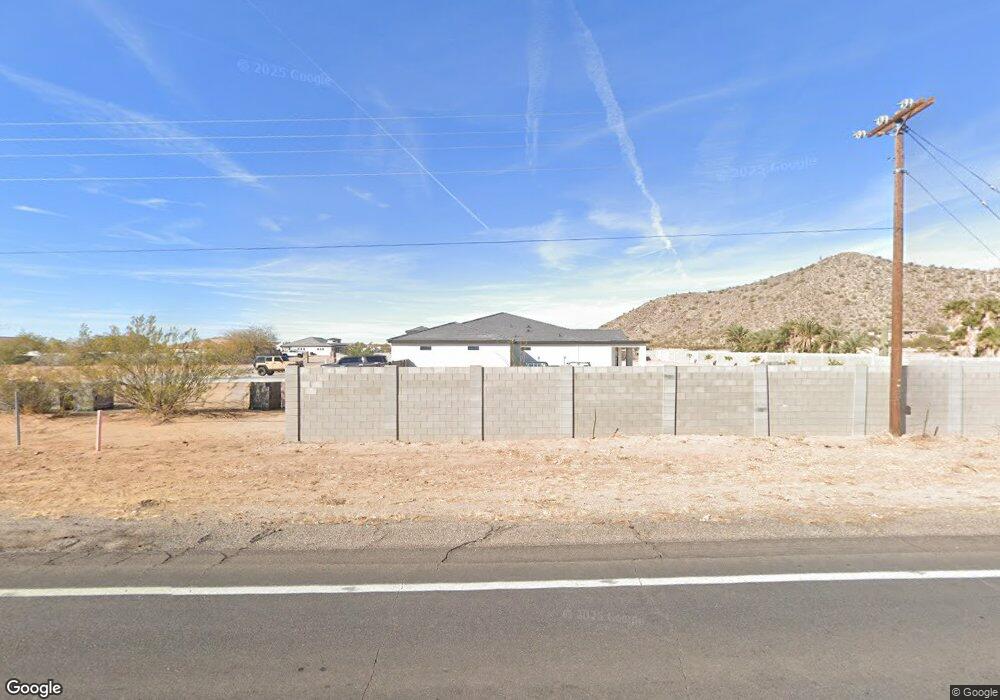
6822 N Overfield Rd Casa Grande, AZ 85194
Estimated Value: $648,000 - $937,293
--
Bed
--
Bath
3,842
Sq Ft
$211/Sq Ft
Est. Value
About This Home
This home is located at 6822 N Overfield Rd, Casa Grande, AZ 85194 and is currently estimated at $809,073, approximately $210 per square foot. 6822 N Overfield Rd is a home with nearby schools including Heartland Ranch Elementary School, Coolidge Jr. High School, and Coolidge High School.
Ownership History
Date
Name
Owned For
Owner Type
Purchase Details
Closed on
Jul 16, 2020
Sold by
Kenland Llc
Bought by
Lopez Jonathan F and Lopez Norma E
Current Estimated Value
Purchase Details
Closed on
Oct 27, 2017
Sold by
Valley High Investors Llp
Bought by
Kenland Llc
Purchase Details
Closed on
Jan 23, 2017
Sold by
Leiman Bruce and Holland Bonnie
Bought by
Kenland Llc
Purchase Details
Closed on
Jan 20, 2017
Sold by
Leiman Bruce and Leiman Kenneth Dale
Bought by
Leiman Bruce
Purchase Details
Closed on
Mar 8, 2016
Sold by
Senter Val
Bought by
Senter Val E
Purchase Details
Closed on
Nov 12, 2013
Sold by
Kekira Land Partners Lp
Bought by
Leiman Kenneth D
Purchase Details
Closed on
Oct 6, 2009
Sold by
Kekira Land Partners Lp
Bought by
Kekira Land Partners Lp
Purchase Details
Closed on
Mar 27, 2000
Sold by
Fairchild Mary Ann
Bought by
Bond A Philip and Bond Julie Ann
Create a Home Valuation Report for This Property
The Home Valuation Report is an in-depth analysis detailing your home's value as well as a comparison with similar homes in the area
Home Values in the Area
Average Home Value in this Area
Purchase History
| Date | Buyer | Sale Price | Title Company |
|---|---|---|---|
| Lopez Jonathan F | $50,000 | Security Title Agency | |
| Kenland Llc | -- | None Available | |
| Kenland Llc | -- | None Available | |
| Leiman Bruce | -- | None Available | |
| Senter Val E | -- | None Available | |
| Leiman Kenneth D | $50,000 | None Available | |
| Kekira Land Partners Lp | -- | None Available | |
| Bond A Philip | $200 | -- | |
| Bond A Philip | $800 | -- |
Source: Public Records
Tax History Compared to Growth
Tax History
| Year | Tax Paid | Tax Assessment Tax Assessment Total Assessment is a certain percentage of the fair market value that is determined by local assessors to be the total taxable value of land and additions on the property. | Land | Improvement |
|---|---|---|---|---|
| 2025 | $5,341 | $68,202 | -- | -- |
| 2024 | $413 | -- | -- | -- |
| 2023 | $428 | $9,495 | $9,495 | $0 |
| 2022 | $413 | $5,451 | $5,451 | $0 |
| 2021 | $434 | $5,484 | $0 | $0 |
| 2020 | $419 | $5,519 | $0 | $0 |
| 2019 | $409 | $5,519 | $0 | $0 |
| 2018 | $381 | $5,197 | $0 | $0 |
| 2017 | $374 | $4,705 | $0 | $0 |
| 2016 | $331 | $2,958 | $2,958 | $0 |
| 2014 | -- | $2,490 | $2,490 | $0 |
Source: Public Records
Map
Nearby Homes
- 8325 W Bartlett Rd
- 8284 W Mccartney Rd
- 7172 W Gelding Ln
- 7171 W Quarter Horse Run
- 5250 N Evans Rd Unit 5250
- 7775 N Overfield Rd
- 7009 W Palomino Way
- 7010 W Quarter Horse Run Unit 89
- 181818 N Thor D Ln Unit D
- 7922 Thor Ln
- 6919 W Mance Ave
- 000 W Woodruff Rd
- 6897 W Appaloosa Trail
- 6786 W Palomino Way
- Lot 5 W Lake Powell Dr Unit 5
- 8998 W Garnet Mountain Dr
- 6673 W Quarter Horse Run
- 9370 W Weaver Cir
- 9087 W Limestone Mountain Dr
- 9186 W Limestone Mountain Dr
- 6884 N Overfield Rd
- 6878 N Overfield Rd
- 7079 N Overfield Rd
- TBD N Overfield Rd
- TBD N Overfield Rd
- TBD N Overfield Rd
- 6776 N Overfield Rd
- 7125 N Overfield Rd Unit D & C
- 8036 W Natalie Ln
- 6855 N Overfield Rd
- 8112 W Natalie Ln
- 6800 N Overfield Rd Unit 30
- 7062 N Overfield Rd
- 7062 N Overfield Rd
- 7062 N Overfield Rd
- 7207 N Overfield Rd Unit B
- 7207 N Overfield Rd Unit A
- 7207 N Overfield Rd Unit C
- 7207 N Overfield Rd Unit D
- 7207 N Overfield Rd