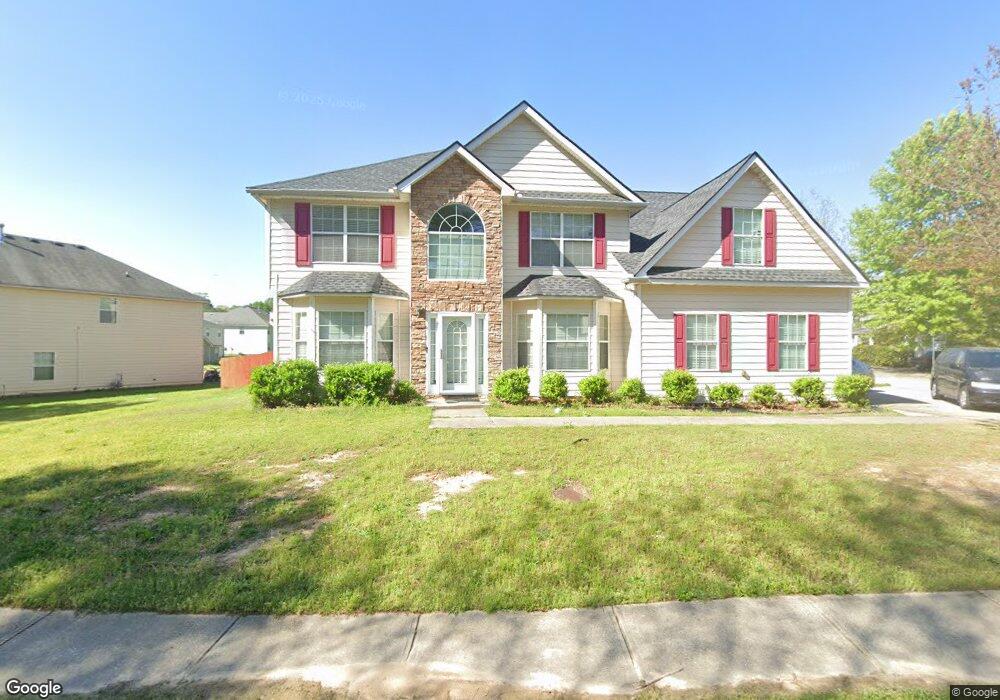
6823 Mancha St Atlanta, GA 30349
Estimated Value: $293,000 - $363,000
4
Beds
3
Baths
3,284
Sq Ft
$98/Sq Ft
Est. Value
About This Home
This home is located at 6823 Mancha St, Atlanta, GA 30349 and is currently estimated at $322,960, approximately $98 per square foot. 6823 Mancha St is a home located in Fulton County with nearby schools including Nolan Elementary School, Mcnair Middle School, and Banneker High School.
Ownership History
Date
Name
Owned For
Owner Type
Purchase Details
Closed on
Mar 22, 2012
Sold by
Tchassama Abasse
Bought by
Tchassama Abasse and Amah Naka Hezouwe
Current Estimated Value
Home Financials for this Owner
Home Financials are based on the most recent Mortgage that was taken out on this home.
Original Mortgage
$85,769
Outstanding Balance
$58,579
Interest Rate
3.75%
Mortgage Type
FHA
Estimated Equity
$264,381
Purchase Details
Closed on
Mar 21, 2012
Sold by
Cooper Len
Bought by
Tchassama Abasse
Home Financials for this Owner
Home Financials are based on the most recent Mortgage that was taken out on this home.
Original Mortgage
$85,769
Outstanding Balance
$58,579
Interest Rate
3.75%
Mortgage Type
FHA
Estimated Equity
$264,381
Purchase Details
Closed on
Sep 22, 2006
Sold by
Legacy Communities Of Heritage
Bought by
Cooper Len and Cooper Latasha
Home Financials for this Owner
Home Financials are based on the most recent Mortgage that was taken out on this home.
Original Mortgage
$168,000
Interest Rate
7.13%
Mortgage Type
New Conventional
Create a Home Valuation Report for This Property
The Home Valuation Report is an in-depth analysis detailing your home's value as well as a comparison with similar homes in the area
Home Values in the Area
Average Home Value in this Area
Purchase History
| Date | Buyer | Sale Price | Title Company |
|---|---|---|---|
| Tchassama Abasse | -- | -- | |
| Tchassama Abasse | $88,000 | -- | |
| Cooper Len | $210,100 | -- |
Source: Public Records
Mortgage History
| Date | Status | Borrower | Loan Amount |
|---|---|---|---|
| Open | Tchassama Abasse | $85,769 | |
| Closed | Tchassama Abasse | $5,000 | |
| Closed | Tchassama Abasse | $85,769 | |
| Closed | Tchassama Abasse | $5,000 | |
| Previous Owner | Cooper Len | $168,000 |
Source: Public Records
Tax History Compared to Growth
Tax History
| Year | Tax Paid | Tax Assessment Tax Assessment Total Assessment is a certain percentage of the fair market value that is determined by local assessors to be the total taxable value of land and additions on the property. | Land | Improvement |
|---|---|---|---|---|
| 2025 | $1,308 | $130,280 | $23,680 | $106,600 |
| 2023 | $3,807 | $134,880 | $32,200 | $102,680 |
| 2022 | $1,213 | $108,280 | $19,520 | $88,760 |
| 2021 | $1,174 | $79,320 | $10,640 | $68,680 |
| 2020 | $1,166 | $78,320 | $10,480 | $67,840 |
| 2019 | $1,457 | $77,000 | $10,320 | $66,680 |
| 2018 | $1,762 | $70,040 | $9,520 | $60,520 |
| 2017 | $1,034 | $46,000 | $8,160 | $37,840 |
| 2016 | $952 | $46,000 | $8,160 | $37,840 |
| 2015 | $955 | $46,000 | $8,160 | $37,840 |
| 2014 | $957 | $46,000 | $8,160 | $37,840 |
Source: Public Records
Map
Nearby Homes
- 2355 Morris Rd
- 355 Espana St
- 310 Espana St
- 325 Espana St
- 0 Camp Valley Rd Unit LL1145 10547020
- 0 Camp Valley Rd Unit LL1152 10547019
- 0 Camp Valley Rd Unit LL1129 10547018
- 2261 Creel Rd
- 6908 Estepona St
- 2540 Thornton Dr
- 2348 Bigwood Trail
- 6765 Dagenhart Rd
- 2334 Bigwood Trail
- 2221 Bigwood Trail
- 2255 Bigwood Trail
- 110 Chippewa Ct
- 6990 Old National Hwy
- 6860 Earlhurst Rd
- 2318 Bigwood Trail
- 6710 Mancha St
- 6819 Mancha St
- 6702 Mancha St
- 6702 Mancha St
- 6707 Mancha St
- 6815 Mancha St
- 6703 Mancha St
- 6711 Mancha St
- 6826 Mancha St
- 6699 Mancha St
- 6822 Mancha St
- 6698 Mancha St
- 6715 Mancha St
- 6818 Mancha St
- 6811 Mancha St
- 6694 Mancha St
- 6719 Mancha St
- 6690 Mancha St
- 6690 Mancha St Unit 40
- 6726 Mancha St